Effluent suspended solids
Contents
Effluent suspended solids#
Parts of this chapter have been published in Water Research 147, 50-59 (2018) [van Dijk et al., 2018].
Abstract#
The main processes contributing to elevated effluent suspended solids in the full-scale aerobic granular sludge process were studied. The two most important processes were (1) rising of sludge due to degasification of nitrogen gas (produced by denitrification) and (2) wash-out of particles that intrinsically do not settle such as certain fats and foams. A mathematical model was made to describe the process of degasification of nitrogen gas during the feeding phase in an AGS reactor. The process of rising sludge due to degasification could be limited by stripping out the nitrogen gas before starting the settling phase in the process cycle. The wash-out of scum particles could be reduced by introducing a vertical scum baffle in front of the effluent weir, similar to weirs in traditional clarifiers. The PNU was operated with a nitrogen stripping phase and scum baffles for 9 months at an average biomass concentration of 10 g L-1 and an average granulation grade of 84 %. In this period the influent suspended solids concentration was 230 ± 118 mg L-1, while the concentration of effluent suspended solids was 7.8 ± 3.8 mg L-1.
Introduction#

Fig. 5 Graphical abstract.#
If we look at the effluent quality of full-scale AGS reactors reported in literature, low effluent values for COD, total nitrogen and total phosphorus can be easily met, but average suspended solids effluent concentrations are relatively high with a range of 5 - 20 mg L-1 (see Table 2).
Plant |
COD |
Ntot-N |
NH4-N |
NO3-N |
Ptot-P |
PO4-P |
SS |
|---|---|---|---|---|---|---|---|
mg L-1 |
mg L-1 |
mg L-1 |
mg L-1 |
mg L-1 |
mg L-1 |
mg L-1 |
|
Epe2 |
0.5 |
4 |
0.5 |
10-20 |
|||
Dinxperlo2 |
0.2 |
5 |
2 |
15-20 |
|||
Gansbaai3 |
40 |
<10 |
<1 |
3.2 |
\(<\)5 |
||
Garmerwolde4 |
64 |
6.9 |
1.1 |
0.9 |
0.4 |
20 |
|
Ryki5 |
45 |
5.60 |
0.85 |
13 |
|||
Vroomshoop5 |
55 |
7.2 |
1.4/3.01 |
2.0 |
0.9 |
0.6 |
10 |
Some reports indicate an increase in effluent suspended solids concentrations for AGS reactors with increasing granulation [Li et al., 2008, Rocktäschel et al., 2015]. In most laboratory studies the focus is on the granulation process and wasting of sludge for ease of operation is combined with decanting of the effluent [de Kreuk et al., 2005]. As a result, biomass is present in the effluent of laboratory reactors. This poses no problem under laboratory conditions, but for the full-scale treatment of sewage the removal of suspended solids is an integral part of the purification process and is usually limited by law. Since hydraulics of laboratory and even pilot plant installations are not representative for full-scale conditions, effluent suspended solids can only effectively be studied at full-scale installations. In full-scale applications the effluent and sludge withdrawal are separated processes. This leads to relatively low suspended solids effluent concentrations, certainly when compared to influent values [Pronk et al., 2015]. Still, the reported average values of 5 - 30 mg L-1 are higher than usually reported for conventional activated sludge processes, which can be considerably lower than 10 mg L-1 [Parker et al., 2001].
Elevated levels of effluent suspended solids have been intensively studied over the last decades in conventional activated sludge systems. Commonly reported issues in these systems are bulking sludge and foam formation [Jenkins, 1992]. Another reported issue in secondary clarifiers is the rising of sludge due to denitrification [Henze et al., 1993]. Denitrification can lead to nitrogen bubble formation (degasification) if over-saturation of nitrogen gas in the liquid is reached. The bubbles attach to the sludge flocs which then rise towards the top of the clarifier and wash out with the effluent.
Sludge settling too fast, indicated by a low sludge volume index (SVI), is also reported to cause elevated levels of suspended solids in the effluent of conventional activated sludge systems, although this effect is doubted by others reporting a strong relation with the flocculator design [Parker et al., 1996, Parker et al., 2001, Vitasovic et al., 1997]. Since reported SVI values for full-scale AGS reactors are generally low (35 - 70 mL g-1) [Pronk et al., 2015, van der Roest et al., 2011] this might also be a potential cause of elevated levels of effluent suspended solids.
Besides a different sludge morphology and likely flocculation behaviour, current AGS plants according to the Nereda® concept deviate also in hydraulics from secondary settling tanks. Secondary clarifiers have typical superficial upflow velocities of 0.5 - 1.0 m h-1, while the complex flow in the clarifier is mainly caused by density currents [Zhou et al., 1992]. For the Nereda® technology effluent results from pumping influent in the bottom of the granular bed. This generates an upward plug flow in the reactor with typical superficial velocities in the range of 2 - 5 m h-1 through a granular bed with on top of that a layer of flocculent sludge. The relatively higher upflow velocities in Nereda® reactors might be responsible for the washout of floating sludge and fat-like particles. In contrast to conventional activated sludge systems, the mechanisms behind the formation and control of effluent suspended solids for full-scale aerobic granular sludge reactors are not yet fully understood.
The aim of this study was to evaluate the main processes leading to effluent suspended solids in full-scale AGS reactors, and investigate options to minimize effluent suspended solids. We focused on both removal of floating material and degasification of nitrogen gas. Full-scale experiments were performed in the PNU and a mathematical model was developed to describe the degasification of nitrogen gas during the operation of the aerobic granular sludge reactor.
Materials and methods#
Description of the plant#
Experiments were done in the \glsdesc{pnu}. The reactor has a footprint of 150 m2 and a water depth of 7.00 m. The influent pumps have a total capacity of 900 m3 h-1. The influent is pumped directly from a main sewer line of the Overvecht district in Utrecht. The sewage consists mainly of domestic wastewater. Wastewater characteristics during this study are given in Table 3. After screening by a 6 mm perforated plate screen, the wastewater is directly pumped into the reactor. During the trial the reactor was operated at a MLSS concentration of 8 - 12 kg m-3, a SVI5 of 34 - 57 mL g-1 , a SVI30 of 33 - 43 mL g-1, a volumetric loading rate of 0.6 - 2.7 m3 m-3 d-1 and an average sludge loading rate of 0.08 kgCOD kgMLSS d-1. On average 84 % of the biomass present in the reactor was granulated during the experimental period (i.e. granule size larger than 0.2 mm). Average granule size distributions are shown in Table 4. The reactor is equipped with two blowers each with a capacity of 400 m3 h-1. Air is supplied to the reactor using micro bubble diffusors evenly distributed on the floor of the tank.
Average |
Min |
Max |
|
|---|---|---|---|
Parameter |
mg L-1 |
mg L-1 |
mg L-1 |
COD |
707.0 |
442.4 |
1007.5 |
NKj |
64.0 |
35.0 |
81.7 |
NH4-N |
46.1 |
25.1 |
58.6 |
Ptot-P |
8.9 |
5.3 |
11.8 |
PO4-P |
5.6 |
3.2 |
8.2 |
SS |
230.0 |
160.0 |
380.0 |
The reactor was operated with a normal Nereda® cycle as described in section Nereda technology. Process conditions were set to target full biological nitrogen and phosphorus removal. No possibilities for chemical dosing were present in the reactor. During the trial nitrogen removal was established by nitrification and denitrification.
The cycle time varied between 4 and 8 hours, with 1 hour of anaerobic feeding and simultaneous effluent withdrawal, a variable reaction phase and a phase for mixing, settling and decanting of sludge of 30 to 60 minutes.
The reaction phase was stopped when the set points, 2 mg L-1 and 3 mg L-1 for respectively ammonia and nitrate were reached. During the reaction phase the dissolved oxygen concentration was controlled in the range of 1.0 - 2.0 mg L-1.
The plant is in operation since the 1st of April 2013. The reactor was started up without baffles in front of the overflow weir. On the 3rd of June 2015 vertical baffles were placed in front of the effluent weirs, to investigate the effect of scum baffles on the concentration of effluent suspended solids.
Online measurements#
The reactor was equipped with probes for dissolved oxygen, redox potential, water level, temperature, turbidity, and nitrate. Ammonium and phosphate were continuously measured using a filter unit and auto sampling device (Hach Lange; Filtrax, Amtax and Phosphax). The filter unit was situated 0.5 meter below the water surface. Sampling was done at an interval of 5 minutes. A turbidity sensor (Hach Lange; Solitax) was present in the effluent gutter to observe the presence of suspended solids.
Sampling#
Samples for analyses of influent and effluent were collected using refrigerated auto samplers, collecting flow proportional samples for both influent and effluent. Suspended solids concentrations of both influent and effluent were measured by filtering 1 L of sample with a glass fiber filter, which was dried at 105 °C until no weight change was measured.
Grab samples for MLSS analyses were taken from the top of the reactor after at least 15 minutes of aeration at full capacity to ensure sufficiently mixed conditions.
Physical characteristics of the sludge#
To determine the granule size distribution 1 L of sample was poured over a series of sieves with different mesh sizes (200 µm, 400 µm, 630 µm, 1000 µm and 2000 µm). These sieve fractions together with 100 mm of unsieved sludge were dried at 105 °C. The sludge volume index (SVI) was measured by pouring 1000 mm of mixed, undiluted sludge into a graduated measuring cylinder. The sludge volumes were measured after 5 and 30 minutes.
sieve fraction |
MLSS |
granule fraction |
|---|---|---|
µm |
kg m-3 |
% |
0 - 200 |
1.7 |
16 % |
200 - 400 |
0.3 |
3 % |
400 - 600 |
0.2 |
2 % |
600 - 1000 |
0.4 |
4 % |
1000 - 2000 |
3.2 |
31 % |
>2000 |
4.6 |
44 % |
Total |
10.4 |
100 % |
Microscopic analysis#
A Leica Microsystems Ltd stereo zoom microscope (M205 FA) in combination with Leica Microsystems Qwin (V3.5.1) image analysis software was used to analyse the morphology of the sludge.
Modelling of N2 stripping#
A mathematical model was developed to calculate the concentrations of dissolved nitrogen gas in the reactor. The solubility of nitrogen gas in water, \(c_s\), is dependent on the partial pressure of nitrogen gas in the gas phase, \(p\), and is calculated using Henry’s law:
Here \(k_H\) is the Henry’s constant for the solubility of nitrogen gas in water and \(M\) is the molar mass of nitrogen gas. The Henry’s constant is a decreasing function of temperature, meaning that the solubility of nitrogen gas in water decreases with an increasing temperature. The partial pressure of nitrogen in the gas phase is both dependent on the gas fraction, \(f\), and the pressure in the reactor, the latter being the sum of atmospheric pressure, \(p_{atm}\) and hydrostatic pressure:
Here \(x\) is the water depth, \(\rho\) is the mixture density and \(g\) is the gravitational acceleration.
The transfer of nitrogen gas between the air bubbles and the liquid is calculated by:
Here \(c\) is the nitrogen gas concentration in the water phase, \(k_L\) is the mass transfer coefficient and \(a\) is the interfacial area of the gas bubbles. The subscripts \(O\) and \(N\) indicate the values for oxygen gas and nitrogen gas. The mass transfer rate is corrected for effects of wastewater contaminants, \(\alpha\), and fouling on the membrane aerators, \(F\). The value of the product of \(k_L\) and \(a\) for oxygen transfer \({\left(k_L a\right)_O}\), is commonly measured during commissioning in full-scale wastewater treatment plants and depends on the temperature. For this study, a value of \({\left(k_L a\right)_O}\) including the effects of contaminants and fouling was used. For this, the values for \(\alpha\) and \(F\) were set to 1.
This empirical value of \({\left(k_L a\right)_O}\) can be used to derive a value for nitrogen gas by using Higbie’s penetration theory [Higbie, 1935]. Based on this model the following relation between the \(k_La\) for oxygen gas and nitrogen gas and the diffusion coefficient for oxygen gas (\(D_O\)) and nitrogen gas (\(D_N\)) for can be derived:
Both the diffusion coefficient and the Henry coefficient need to be corrected for temperature. For the diffusion coefficient this is based on the Stokes-Einstein equation [Einstein, 1905]. In this equation the diffusion coefficient \(D\) is related to the temperature \(T\) and the dynamic viscosity \(\mu_T\):
The viscosity is also depending on temperature according to equation the Vogel-Fulcher-Tammann equation [Dagdug, 2000], in which parameters A, B and C are empirical parameters:
The Henry coefficient is corrected for temperature using the van ‘t Hoff equation [van't Hoff, 1884], in which \(k_{H0}\) is the Henry coefficient at reference temperature, \(T_0\) is the reference temperature and \(H_c\) is the temperature correction factor:
The stripping of nitrogen gas is done by aeration of the reactor with fine bubble aeration. This leads to transport of dissolved nitrogen gas through the reactor. A simple axial dispersion model can be used to describe the liquid backmixing of dissolved nitrogen gas in the reactor [Degaleesan and Dudukovic, 1998], in which \(x\) is the water depth.
The axial dispersion coefficient, \(D_{ax,1}\), is a lumped coefficient, containing the effect of both turbulent dispersion and global convective recirculation in the reactor. Molecular diffusion in this case is neglected due to an expected limited impact. A tracer experiment with ammonium was used to determine the value of \(D_{ax,1}\).
To describe the transfer of nitrogen gas between the air bubbles and the water phase, equation (4) is substituted in equation (3). If this equation is combined with the transport of nitrogen gas in the water phase according equation (8) a description for the stripping of nitrogen in a 1D bubble column is constructed:
The saturation concentration for nitrogen gas according to equation (1) can be combined with the actual concentration to calculate the nitrogen gas deficit in the bulk liquid, \(c_{d}\).
When over-saturation occurs during aeration (i.e. the actual concentration \(c\) is higher than \(c_s\) at ambient pressure and temperature), it is assumed that N2 gas bubbles are formed immediately and efficiently stripped out of the bulk liquid. This is modelled by artificially increasing the local \(k_La\) with an order of magnitude.
Modelling of mixing during imperfect plug flow feeding#
During feeding the bulk liquid in the reactor is pushed up towards the top of the reactor where the overflow weirs are situated. To describe the transport of nitrogen gas during feeding, the same axial dispersion model of equation (8) is used with a different value for \(D_{ax}\). Also an additional term is added to describe the transport of nitrogen gas through convection. Here, \(v\) is the upflow velocity of the liquid in the reactor. The value of \(D_{ax,2}\) was experimentally established by measuring a step response curve with ammonium as a tracer.
The influent is fed from the bottom of the reactor. It is assumed that the influent concentration of dissolved nitrogen is equal to the equilibrium concentration of nitrogen gas at atmospheric pressure. During the feeding phase denitrification can take place. The denitrification rate depends on many parameters, but in this case a lumped specific denitrification rate, \(q\), is used. The specific denitrification rate was measured in the reactor in the days before the experiment, by measuring the decrease of the nitrate concentration during an anoxic phase in the cycle. This rate is multiplied by the biomass concentration, \(c_X\), which is a function of the reactor depth. The sludge bed is assumed to be in steady state and thus invariable in time. In the simulations it was assumed that the sludge bed occupies the lower 4 meters of the reactor and that the sludge is evenly distributed. We can then write equation (11) as follows:
In this model the water in the reactor can get over-saturated with nitrogen gas. This means that the local concentration of nitrogen gas, \(c\), becomes larger than the local saturation concentration according to equation (1). It is assumed that nitrogen gas bubbles are formed immediately after over-saturation. Most likely supersaturation of nitrogen gas can occur, but the effect is assumed to be limited [Henze et al., 1993].
All model parameters are given in Table 5.
Parameter |
Symbol |
Value |
Unit |
|---|---|---|---|
Henry’s constant for N2 (25 °C) |
\(k_h\) |
6.4 x 10⁻⁶ |
mole m-3 Pa -1 |
Temperature coefficient N2 |
\(k_{hc}\) |
1300 |
K |
Molar mass N2 |
\(M\) |
28 |
g mole-1 |
Gas fraction of N2 in air |
\(f\) |
0.78 |
- |
Atmospheric pressure |
\(p_{atm}\) |
101,325 |
Pa |
Density of water |
\(\rho\) |
1000 |
kg m-3 |
Gravity acceleration |
\(g\) |
9.81 |
m s-2 |
Alpha factor |
\(\alpha\) |
1 |
- |
Fouling factor |
\(F\) |
1 |
- |
Gas transfer rate for oxygen |
\({\left(k_L a\right)_O}\) |
5.5 |
h-1 |
Diffusion coefficient \ch{O2} (25 °C) |
\(D_O\) |
2.10 x 10⁻⁹ |
m2 s-1 |
Diffusion coefficient N2 (25 °C) |
\(D_N\) |
1.88 x 10⁻⁹ |
m2 s-1 |
Empirical coefficient A |
\(A\) |
-10.6265 |
- |
Empirical coefficient B |
\(B\) |
578.919 |
- |
Empirical coefficient C |
\(C\) |
-137.546 |
- |
Axial dispersion during aeration |
\(D_{ax,1}\) |
1.0 x 10⁻² |
m2 s-1 |
Axial dispersion during feeding |
\(D_{ax,2}\) |
1.0 x 10⁻⁴ |
m2 s-1 |
Results#
Reactor operation#
The data were collected between June 2015 and May 2016. In this period the reactor was running stable and without interruption with average effluent values of COD of 41 mg L-1, Nkj-N of 4.05 mg L-1, NH4+-N of 1.29 mg L-1, NO3--N of 3.72 mg L-1, Ptot-P of 0.51 mg L-1 and PO43--P of 0.26 mg L-1, showing a highly efficient N and P removal of respectively 94 % and 91 %. The average granule size distribution is reported in Table 4. The sludge in the reactor mainly consisted of smooth granules larger than 1 mm, which is also shown by the microscopic image of the sludge in Fig. 6A. The water temperature was in the range of 9 - 23 °C.
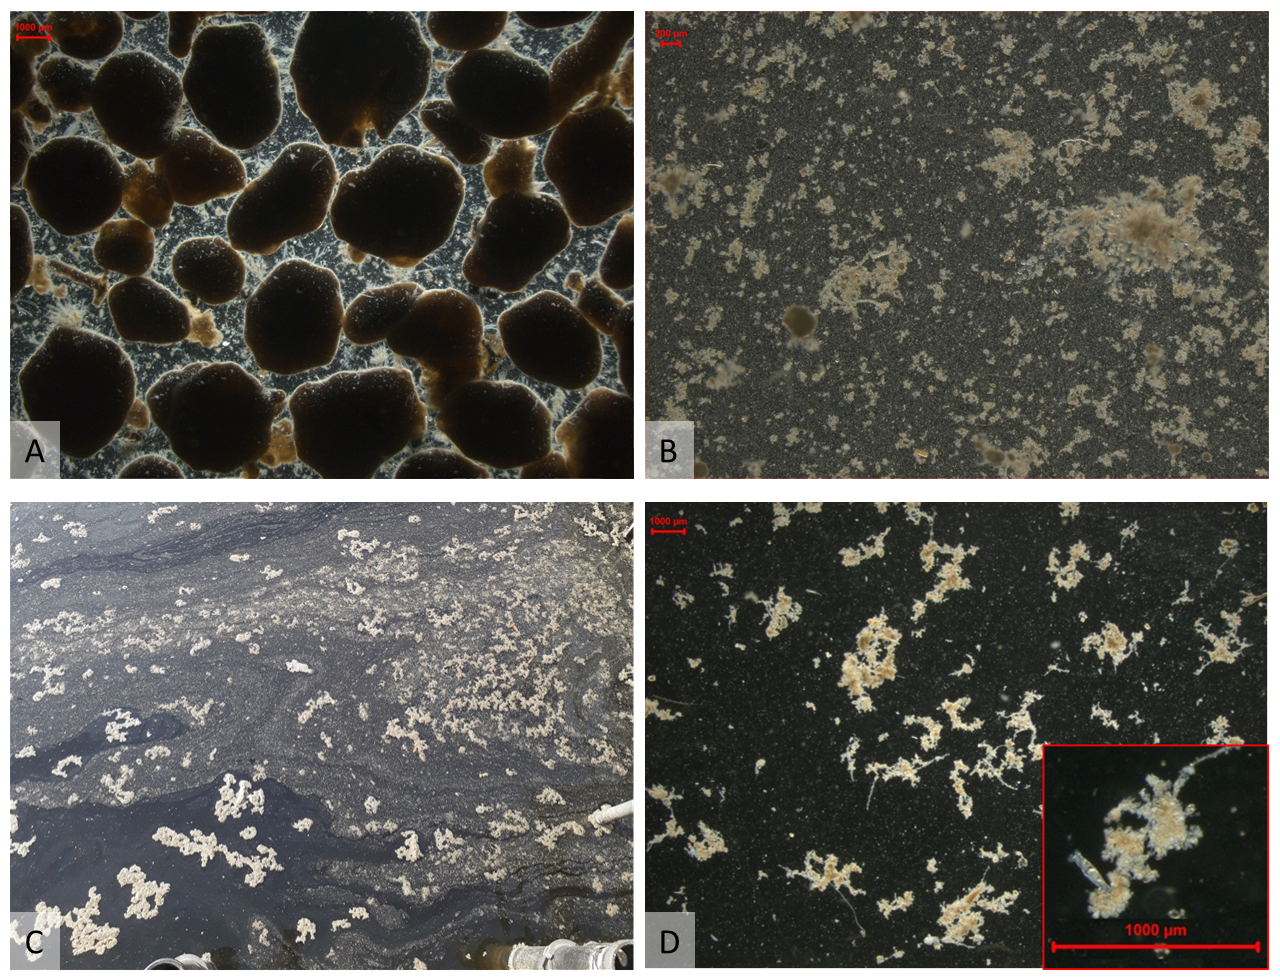
Fig. 6 Biomass in the Prototype Nereda® Utrecht: (A) granules in the reactor, (B) light microscopic picture of effluent suspended solids, (C) scum on top of the reactor after installation of the baffles, (D) biomass from the top of the reactor.#
Degasification of nitrogen gas#
Due to denitrification and upward transport of liquid (decreasing local pressure) over-saturation of the water phase with nitrogen gas can occur, leading to gas bubble formation in the feeding/decanting period. To confirm that over-saturation of nitrogen gas is present during parts of the cycle an experiment was performed. Two comparable batches were fed to the reactor. The batch sizes are given as VER, which is the ratio between the batch size (f.e. 400 m3) and the volume of the reactor (1000 m3). Before the first batch (batch 1) the reactor was intensely aerated before feeding the reactor, while in the second batch (batch 2) this stripping phase was omitted. The gas stripping period was 30 minutes long, with an air flow of 800 m3 h-1. This high value was chosen to strip a maximum amount of nitrogen gas. The process conditions in the two batches were comparable (batch 1: volumetric exchange ratio 40 %, nitrogen removed in previous batch 13.8 mg L-1, average temperature 13.6 °C; batch 2: volumetric exchange ratio 40 %, nitrogen removed in previous batch 13.9 mg L-1, average temperature 13.5 °C). The effect of a stripping phase is clearly illustrated in figure Fig. 7, showing the effluent turbidity for both batches. Batch 1 showed an overall lower level effluent turbidity with a turbidity slightly decreasing over the batch, with an average value of 4.9 FNU. The turbidity in batch 2 was overall higher than in batch 1, with an average value of 21.0 FNU. At a volumetric exchange ratio of 30 % the effluent turbidity started to increase up to a value of 48.5 FNU at the end of batch 2. In Fig. 8 photographs recorded by a security camera are showing the gradual formation of a scum layer due to degasification during batch 2.

Fig. 7 Turbidity of the effluent in a batch with gas stripping (batch 1) and without gas stripping (batch 2).#
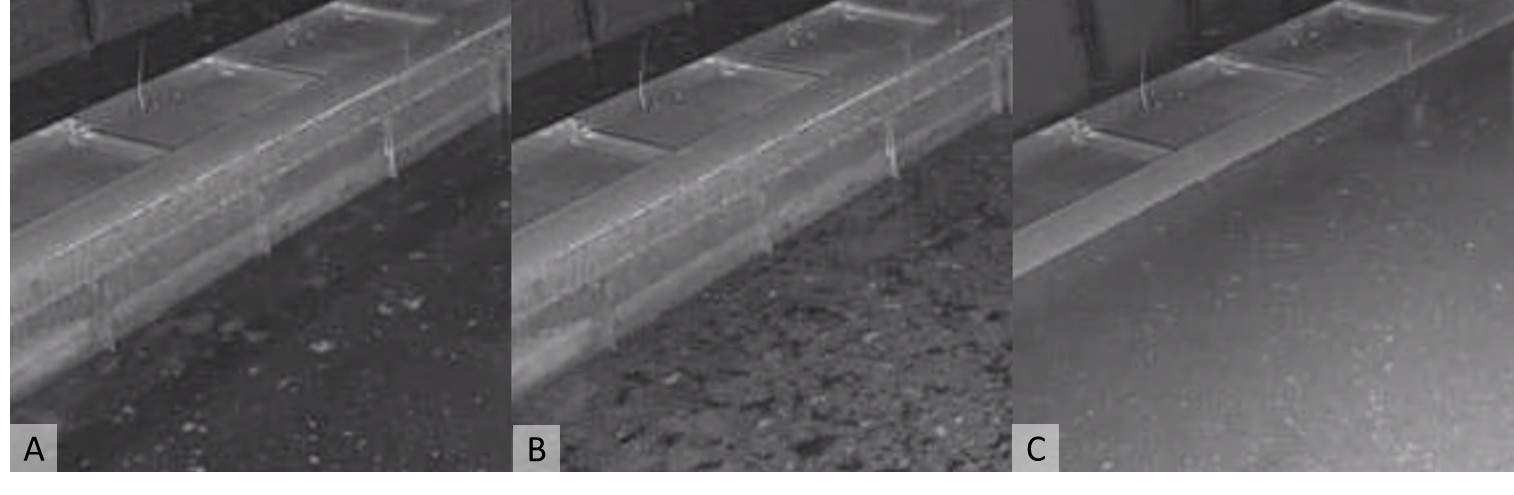
Fig. 8 Degasification and the resulting floatation of biomass during feeding in a batch without stripping: (A) VER = 0 % (B) VER = 20 % (C) VER = 40 %.#
Stripping of nitrogen gas#
Dissolved nitrogen gas can be stripped out by aerating right before the feeding phase to prevent rising of biomass as is shown above. Equation (9), together with equation (1) and (2) for pressure correction, equation (5), equation (6) and equation (7) for temperature correction and equation (4) for the conversion of the kLa can be used to evaluate the effect of the stripping period on the dissolved N2 concentration in the reactor.
In Fig. 9 the effect of stripping of an initially fully N2 saturated situation in the reactor is shown at a temperature of 20 °C. The dissolved nitrogen gas concentration in the reactor (top at 0 m, bottom at 7 m) is shown. The figure shows three coloured zones: the blue zone marks the area where the nitrogen gas concentration is lower than the equilibrium concentration for air (i.e. no degasification expected). The grey zone marks the area where the nitrogen gas concentration is higher than the equilibrium concentration for pure nitrogen gas (i.e. degasification expected). The white zone marks the area where only a partial nitrogen gas deficit exists. The boundary between the blue area and the white area is calculated according to equation (1) and equation (2) with a gas fraction of nitrogen gas in air at ambient water pressure and temperature (f=78 %). The boundary between the white and the grey area is calculated in a similar manner, but with pure nitrogen gas bubbles (f=100 %).
The mixing of the reactor has a large impact on the effect of the stripping phase. Dissolved nitrogen gas is convectively transported through the reactor, leading to an over-saturated situation near the top of the reactor and an undersaturated situation near the bottom of the reactor. When the aeration continues, the nitrogen gas is slowly stripped out of the reactor and a N2 deficit is created at the bottom of the tank. After 15 minutes, due to the mixing, the N2 concentration near the bottom of the reactor is lower than the air equilibrium concentration at 7 meters water depth. However, near the top of the reactor the N2 concentration is still over-saturated. Even after 60 minutes of aeration the nitrogen concentration is still at saturation concentration near the top of the reactor due to upmixing of dissolved N2 gas. Note that for operational conditions over-saturation at the top of the reactor is not important since there is no sludge bed/blanket near the top of the reactor during effluent withdrawal.

Fig. 9 Stripping of N2 gas from fully saturated situation (A) and after 5 minutes (B), 15 minutes (C) and 60 minutes of stripping (D) at 13.5 °C. Black solid line: the actual N2 concentration, grey area: N2 concentration above saturation, blue area: N2 concentration below equilibrium with air, boundary between grey area and white area: N2 concentration at equilibrium with pure nitrogen gas at ambient water pressure, boundary between blue area and white area: N2 concentration at equilibrium with air at ambient water pressure.#

Fig. 10 Effect of feeding after a stripping phase on the dissolved nitrogen gas concentration from the start (A), after 15 minutes (B), after 30 minutes (C) and after 50 minutes (D). T = 13.5 °C, r = 0.25 mg g-1 h-1. Black solid line: the actual N2 concentration, black dashed line: biomass concentration, grey area: N2 concentration above saturation, blue area: N2 concentration below equilibrium with air, boundary between grey area and white area: N2 concentration at equilibrium with pure nitrogen gas at ambient water pressure, boundary between blue area and white area: N2 concentration at equilibrium with air at ambient water pressure.#

Fig. 11 Effect of feeding without a prior stripping phase on the dissolved nitrogen gas concentration from the start (A), after 15 minutes (B), after 30 minutes (C) and after 50 minutes (D). T = 13.5 °C, r = 0.25 mg g-1 h-1. Black solid line: the actual N2 concentration, black dashed line: biomass concentration, grey area: N2 concentration above saturation, blue area: N2 concentration below equilibrium with air, boundary between grey area and white area: N2 concentration at equilibrium with pure nitrogen gas at ambient water pressure, boundary between blue area and white area: N2 concentration at equilibrium with air at ambient water pressure.#
Degasification during feeding#
The effect of denitrification during feeding on degasification of nitrogen gas was also evaluated by extending the model according to equation (12). In Fig. 10 an example is shown for a batch comparable with the previously described batch 1 in which a stripping phase of 30 minutes is applied, with T = 13.5 °C, r = 0.25 mg g-1 h-1.
The model shows limited over-saturation during the feeding period of 1 hour, but the over-saturation only occurs above the sludge blanket so rising of sludge due to bubble formation is not likely to happen.
If the stripping phase is reduced to 5 minutes, again with T = 13.5 °C, r = 0.25 mg g-1 h-1, a situation comparable with the above described batch 2 experiment can be modelled. The results are shown in Fig. 11. The water in the vicinity of the sludge blanket is almost immediately slightly over-saturated with nitrogen gas. After 30 minutes the top of the sludge blanket is fully over-saturated with nitrogen gas, which most likely will lead to rising sludge as the escaping nitrogen bubbles get caught by small flocs near the supernatant - sludge interface.
Identification of suspended solids in the effluent#
The suspended solids present in the effluent were examined under a stereo-zoom microscope to determine the characteristics and possible origin. Fig. 6b and Fig. 6d show that the suspended solids in the effluent are small dense light brown flocs. No filamentous organisms like Thiothrix spp. or Microthrix spp. were observed that would normally be associated with bad settling sludge (Fig. 6d). It was also observed that after light shaking of the sample flask the suspended solids quickly settled to the bottom indicating that the suspended solids were able to settle well.
Effect of the vertical baffle#
During the first experimental period (between April 2013 and May 2015) the average suspended solids effluent concentration was 30 mg L-1 with a 50-percentile value of 19.8 mg L-1. In the same period, many values below 10 mg L-1 were also recorded with a 25-percentile value of 9.3 mg L-1. On the 3rd of June 2015 vertical baffles were installed in front of the overflow weirs. Composite samples of the effluent of the reactor were taken in the period immediately before and after the baffles were installed; i.e. under similar operational and sludge characteristics. Fig. 12 shows the effluent suspended solids in this period. In the period immediately before installation of the baffles the average effluent suspended solids concentration was 23 mg L-1, which is 10 % of the influent suspended solids concentration. In the period directly after installation of the baffles only 1 sample was above 10 mg L-1 with a total average of 7.2 mg L-1. In the period June 2015 to May 2016, 175 composite influent and effluent samples were taken by the local water authority. The suspended solids concentration in the influent was 230 ± 180 mg L-1 and the concentration of effluent suspended solids was 7.8 ± 3.8 mg L-1 with a 95-percentile value of 13.6 mg L-1. The average removal efficiency of suspended solids was 97 %. After installation of the baffles a thin layer of scum was present in most batches during feeding (Fig. 6c), but in this period no built up of scum was observed. The thin layer of scum always disappeared in the first few minutes of the reaction phase of the cycle.

Fig. 12 Suspended solids concentration in the effluent before and after installation of vertical baffle in front of the overflow weirs.#
Discussion#
Comparison with floc systems#
In this study we examined the main processes for production of effluent suspended solids in full-scale aerobic granular sludge reactors. The problem of rising sludge is known from both continuously fed activated sludge systems [Henze et al., 1993] as from sequencing batch reactors [Torà et al., 2011]. Comparison of the flow patterns in a secondary clarifier and the AGS reactor reveals some important differences (Fig. 13). The outflow from an aeration tank towards a secondary clarifier generally flows over a weir making the water pressure almost atmospheric and generating a lot of turbulence. This is an effective way to remove at least part of the dissolved nitrogen gas. Subsequently, the water from the aeration tank flows into the secondary clarifier through the centre well where the water pressure is close to atmospheric pressure again. In the clarifier the flow splits into effluent and return sludge. The return sludge is removed from the bottom of the clarifier. During dry weather conditions a limited amount of sludge is present in the clarifier and this sludge will be near the bottom of the clarifier at a water pressure well above atmospheric pressure. If the water pressure increases at higher water depth, automatically the nitrogen gas deficit increases. Thus, if nitrogen gas is formed in a clarifier due to denitrification this will mainly take place at the bottom of the clarifier, where a relatively high nitrogen gas deficit is present. This is probably why degasification in a clarifier is not a very common problem and is only known from high loaded systems at high temperatures with high denitrification rates [Sarioglu and Horan, 1996] or when the inflow to the clarifier is not degassed at an overflow weir. In the AGS reactor the influent is fed from the bottom of the reactor, pushing the with nitrogen gas saturated water in the reactor upwards to lower water pressure. This process is comparable with the process occurring in a sequencing batch reactor, where degasification can occur while decanting the effluent and thereby decreasing the water pressure. Thus, while feeding the reactor, the upwards moving liquid gets a lower saturation concentration for nitrogen gas, while in a clarifier it gets increased. In the AGS reactor during feeding, denitrification of remaining nitrate on storage polymers by GAO and PAO like organisms, built up in previous cycles, can occur [Kuba et al., 1996]. The combination of a lower nitrogen gas deficit due to pressure decrease and a higher denitrification potential make the AGS reactor more susceptible for degasification of nitrogen gas in comparison to a clarifier. Therefore, washout of suspended solids due to degasification of nitrogen gas is less common in clarifiers than in AGS reactors.

Fig. 13 Comparison of flow in an AGS reactor (left) and flow in a conventional aeration tank and clarifier (right).#
Effect of N2 stripping#
Rising of sludge due to degasification of dissolved N2 gas can cause elevated levels of suspended solids in the effluent of activated sludge and AGS plants. Experimentally it was shown that a nitrogen gas stripping phase just before the influent feeding phase was effective to prevent rising of sludge in the AGS process. The developed mathematical model shows that a limited amount of N2 gas deficit can be reached by applying a stripping phase. When the water is pushed up during the feeding phase almost immediate over-saturation occurs when no stripping phase is applied.
The model presented by Henze et al. [Henze et al., 1993] only showed a steady state N2 gas deficit in an unmixed situation. This model was extended to show the effect of non-steady state aeration and feeding. A convection/dispersion term was added to the model to describe both mixing due to aeration of the reactor and the plug flow behaviour of the AGS reactor during feeding. The model shows that the local dissolved N2 gas concentration changes over time and depth of the reactor. The maximum deficit for N2 gas depends highly on the temperature, as do the denitrification rates. The model can easily be extended to calculate the risk of rising sludge based on temperature, batch size and aeration history of the reactor. Denitrification rates increase with temperature and the N2 gas deficit will decrease with temperature. At temperatures above 20 °C the need for a stripping phase increases. It should be realized that for the denitrification during the settling/feeding phase mainly residual COD from the previous cycles is used. The COD containing influent is replacing the nitrate containing liquid in the reactor. Therefore, influent COD and nitrate will only mix after the feeding phase when the aeration is switched on.
Effect of the scum baffle#
Introduction of the vertical scum baffles in front of the effluent weir lowered the effluent suspended solids concentration from 23 mg L-1 to 7 mg L-1. Analyses of the suspended solids in the effluent before installation of the baffles did not show any significant presence of granules or filamentous bacteria. Microscopic analyses only revealed the presence of small sludge flocs. The thin layer of sludge present on the surface of the reactor during feeding, observed after installation of the baffles apparently was the result of the blocking of wash-out of floating sludge by the baffles. The same effect is known from clarifiers in activated sludge systems [Metcalf & Eddy, 2013].
It was shown that at a MLSS concentration of 10.1 g L-1 and an influent suspended solids of 230 mg L-1 an effluent suspended solids concentration below 10 mg L-1 was obtained over long-term operation. The flocs present in the layer on top of the reactor are assumed to be grown in the reactor. Apparently, not all biomass grown in the reactor is granular. The flocculent mass likely consists of non-biodegradable inert COD from the influent and detached biomass from the granules. This is also shown by the fractionation of the sludge showing an average 16 % of mass smaller than 200 µm.
The influent of the reactor contained an average of 230 mg L-1 of TSS after screening. Since the only pre-treatment of the reactor was a 6 mm perforated plate screen, some floating material from the sewerage will end up in the reactor. Although the influent consists merely of domestic wastewater, the sewage of the Overvecht district is known to contain relatively large fraction of fat. Some fatlike particles were observed in the reactor, but in the period of 10 months in which the experiment was run, no build-up of scum or fat on the reactor was observed. Apparently, the fat particles were converted or removed with the excess sludge.
The reported values of effluent suspended solids of 20 mg L-1 for the Garmerwolde plant [Pronk et al., 2015] are comparable with the levels measured in this study before installation of the vertical baffles in front of the effluent weirs. Since the Garmerwolde plant mainly treats domestic sewage and also the pre-treatment of the wastewater is comparable, these levels of effluent suspended solids are to be expected. Also reported values for other plants (Table 2) were in the range of 10 - 20 mg L-1 and thus comparable with the values measured in this study before installation of the vertical baffle. This value is to be expected from a full-scale aerobic granular sludge reactor on domestic wastewater if no baffle is present. The Gansbaai plant is the exception, with a value of 5 mg L-1, but detailed information is not available. Baffles have proven to be an effective and economic way to keep effluent suspended solids below 10 mg L-1, similar to well operated secondary clarifier effluents.
Conclusions#
In this study, two main processes have been identified that can contribute to elevated suspended solids concentration in the effluent of the aerobic granular sludge process in practice. These processes also play an important role in suspended solids control in secondary clarifiers of activated sludge plants. Two solutions known from operation of secondary clarifiers could successfully be incorporated into the AGS process leading to low concentration of suspended solids in the effluent. The implementation of nitrogen stripping, before the settling period, avoids gas bubble formation during feeding and thus the floatation of lighter biomass. A mathematical model describing degasification was developed that explains the observations of higher suspended solids concentrations in the effluent when treating sewage. Introduction of a vertical baffle in front of the effluent weir showed to be an effective measure to keep floating sludge and fat-like particle in the reactor, resulting in an effluent suspended solids concentration lower than 10 mg L-1 with an average influent suspended solids concentration of 230 mg L-1. This was achieved with high biomass concentrations (10 g L-1) and a high granulation grade (84 %).