Nitrous oxide emission
Contents
Nitrous oxide emission#
Parts of this chapter have been published in Water Research 198, 117159 (2021) [van Dijk et al., 2021] .
Abstract#
The nitrous oxides emission was measured over 7 months in the full-scale aerobic granular sludge plant in Dinxperlo. Nitrous oxide concentrations were measured in the bulk liquid and the off-gas of the Nereda® reactor. Combined with the batch wise operation of the reactor, this gave a high information density and a better insight into nitrous oxide emission in general. The average emission factor was 0.33 % based on the total nitrogen concentration in the influent. The yearly average emission factor was estimated to be between 0.25 % and 0.30 % of the nitrogen load. The average emission factor is comparable to continuous activated sludge plants, and it is low compared to other sequencing batch systems. The variability in the emission factor increased when the reactor temperature was below 14 °C, showing higher emission factors during the winter period. A change in the process control in the winter period reduced the variability, reducing the emission factors to a level comparable to the summer period. Different process control might be necessary at high and low temperatures to obtain a consistently low nitrous oxide emission. Rainy weather conditions lowered the emission factor, both in the rainy weather batches and the subsequent dry weather flow batches. This was attributed to the first flush from the sewer at the start of rainy weather conditions, resulting in a temporarily increased sludge loading.
Introduction#

Fig. 25 Graphical abstract.#
Nitrous oxide is a greenhouse gas contributing to global warming. Nitrous oxide has a 298 times greater effect on global warming than carbon dioxide [Solomon et al., 2007]. Nitrous oxide can be produced as a by-product of nitrification and denitrification processes [Kampschreur et al., 2009]. Although in general only a small fraction of the influent ammonium is emitted as nitrous oxide, the large greenhouse warming potential can make nitrous oxide emission the dominant factor in the carbon footprint of a wastewater treatment plant [Daelman et al., 2015, Desloover et al., 2012]. Emission of nitrous oxide has been studied for many wastewater treatment process configurations under many process conditions, showing a wide range of emission factors (EF). These emission factors, defined as the amount of nitrous oxide emitted relative to the nitrogen load to the plant, generally fall between 0 % and 5 %, but higher values are also reported [Vasilaki et al., 2019].
Several pathways are shown to be of importance for nitrous oxide production in the wastewater treatment process [Kampschreur et al., 2008, Wunderlin et al., 2012]. In the nitrification process, the intermediate product hydroxylamine can be oxidized to nitrous oxide (both biologically and chemically). Under oxygen-limited conditions, nitrifiers can denitrify nitrite to nitrous oxide, the so-called nitrifier-denitrification pathway. Under anoxic conditions nitrous oxide can be produced by heterotrophic denitrifiers by imbalanced enzyme activity, nitrite accumulation or lack of biodegradable COD [Wunderlin et al., 2012]. At the same time denitrification can be a sink for nitrous oxide, when the reducing capacity of nitrous oxide exceeds the production capacity during denitrification [Conthe et al., 2019]. Fluctuating influent concentrations and seasonal variations in full scale plants combined with the variety of pathways leading to nitrous oxide formation make it very complex to find the underlying processes that lead to elevated nitrous oxide emissions [Daelman et al., 2015, Vasilaki et al., 2019].
Research on nitrous oxide emissions has mainly focused on wastewater treatment processes with flocculent sludge and few laboratory studies have been performed with aerobic granular sludge [Jahn et al., 2019]. This is mainly because the AGS process is a relatively new wastewater treatment process. For the Nereda® process, only short-term (2 weeks) measurements were reported in a pilot reactor and the full-scale reactor in Epe. Both showed an average nitrous oxide emission factor of about 0.7 % of the total nitrogen in the influent [van der Roest et al., 2012], which is comparable to conventional activated sludge plants. However, other studies have shown that to get reliable data on nitrous oxide emissions long-term measurement campaigns are required [Daelman et al., 2015, Gruber et al., 2020, Vasilaki et al., 2019].
There are several laboratory studies reporting on nitrous oxide formation in AGS reactors. These studies reported a wide range of emission factors from 1 % [Lochmatter et al., 2014] to 22 % [Zhang et al., 2015]. Due to the strong deviation from conditions in full-scale reactors in these experiments, it is uncertain how relevant the reported values are regarding full-scale installations. Laboratory systems are very good at isolating a specific parameter, but translation towards full-scale wastewater treatment plants is challenging because of differences in influent composition, process control and reactor design and operation.
Because of the potentially significant contribution to the carbon footprint of full-scale AGS processes, it is important to quantify the nitrous oxide emission factors. Hereto the nitrous oxide emission from a full scale Nereda® plant treating domestic wastewater was monitored for 7 consecutive months. Two different methods were used to measure the nitrous oxide emissions, namely by measuring the nitrous oxide concentrations continuously in the water phase and by measuring it in the off-gas during aeration. The former has the advantage of showing nitrous oxide kinetics under anoxic conditions, when the aeration is turned off. The latter has the benefit of measuring the direct nitrous oxide emission without the need for a conversion algorithm. Combined with the dynamic behaviour of the repeated batch-wise operated system, a high information density could be obtained on the nitrous oxide behaviour from the plant. The goal was to get better insight in the nitrous oxide emissions of the full-scale AGS process, as well as to understand the major factors preventing and leading to elevated nitrous oxide emissions in full scale AGS systems.
Methodology#
Plant description#
All the measurements took place at the Dinxperlo wastewater treatment plant (see also section Nereda® plants used in this research. The influent consists mainly of domestic wastewater (see Table 8), treating on average 3100 m3 d-1, with a peak flow of 570 m3 h-1. Current effluent requirements are: COD of 125 mg L-1, total nitrogen of 15 mg L-1, total phosphorus of 2 mg L-1, and total suspended solids of 30 mg L-1, all yearly averaged values. On top of this, the effluent requirement for phosphorus is 1 mg L-1 in the summer and 3 mg L-1 in the winter. The influent is collected in an influent buffer and then treated in one of the three Nereda® reactors. The effluent is polished by means of a sand filter with the possibility of iron dosing to remove remaining phosphorus.
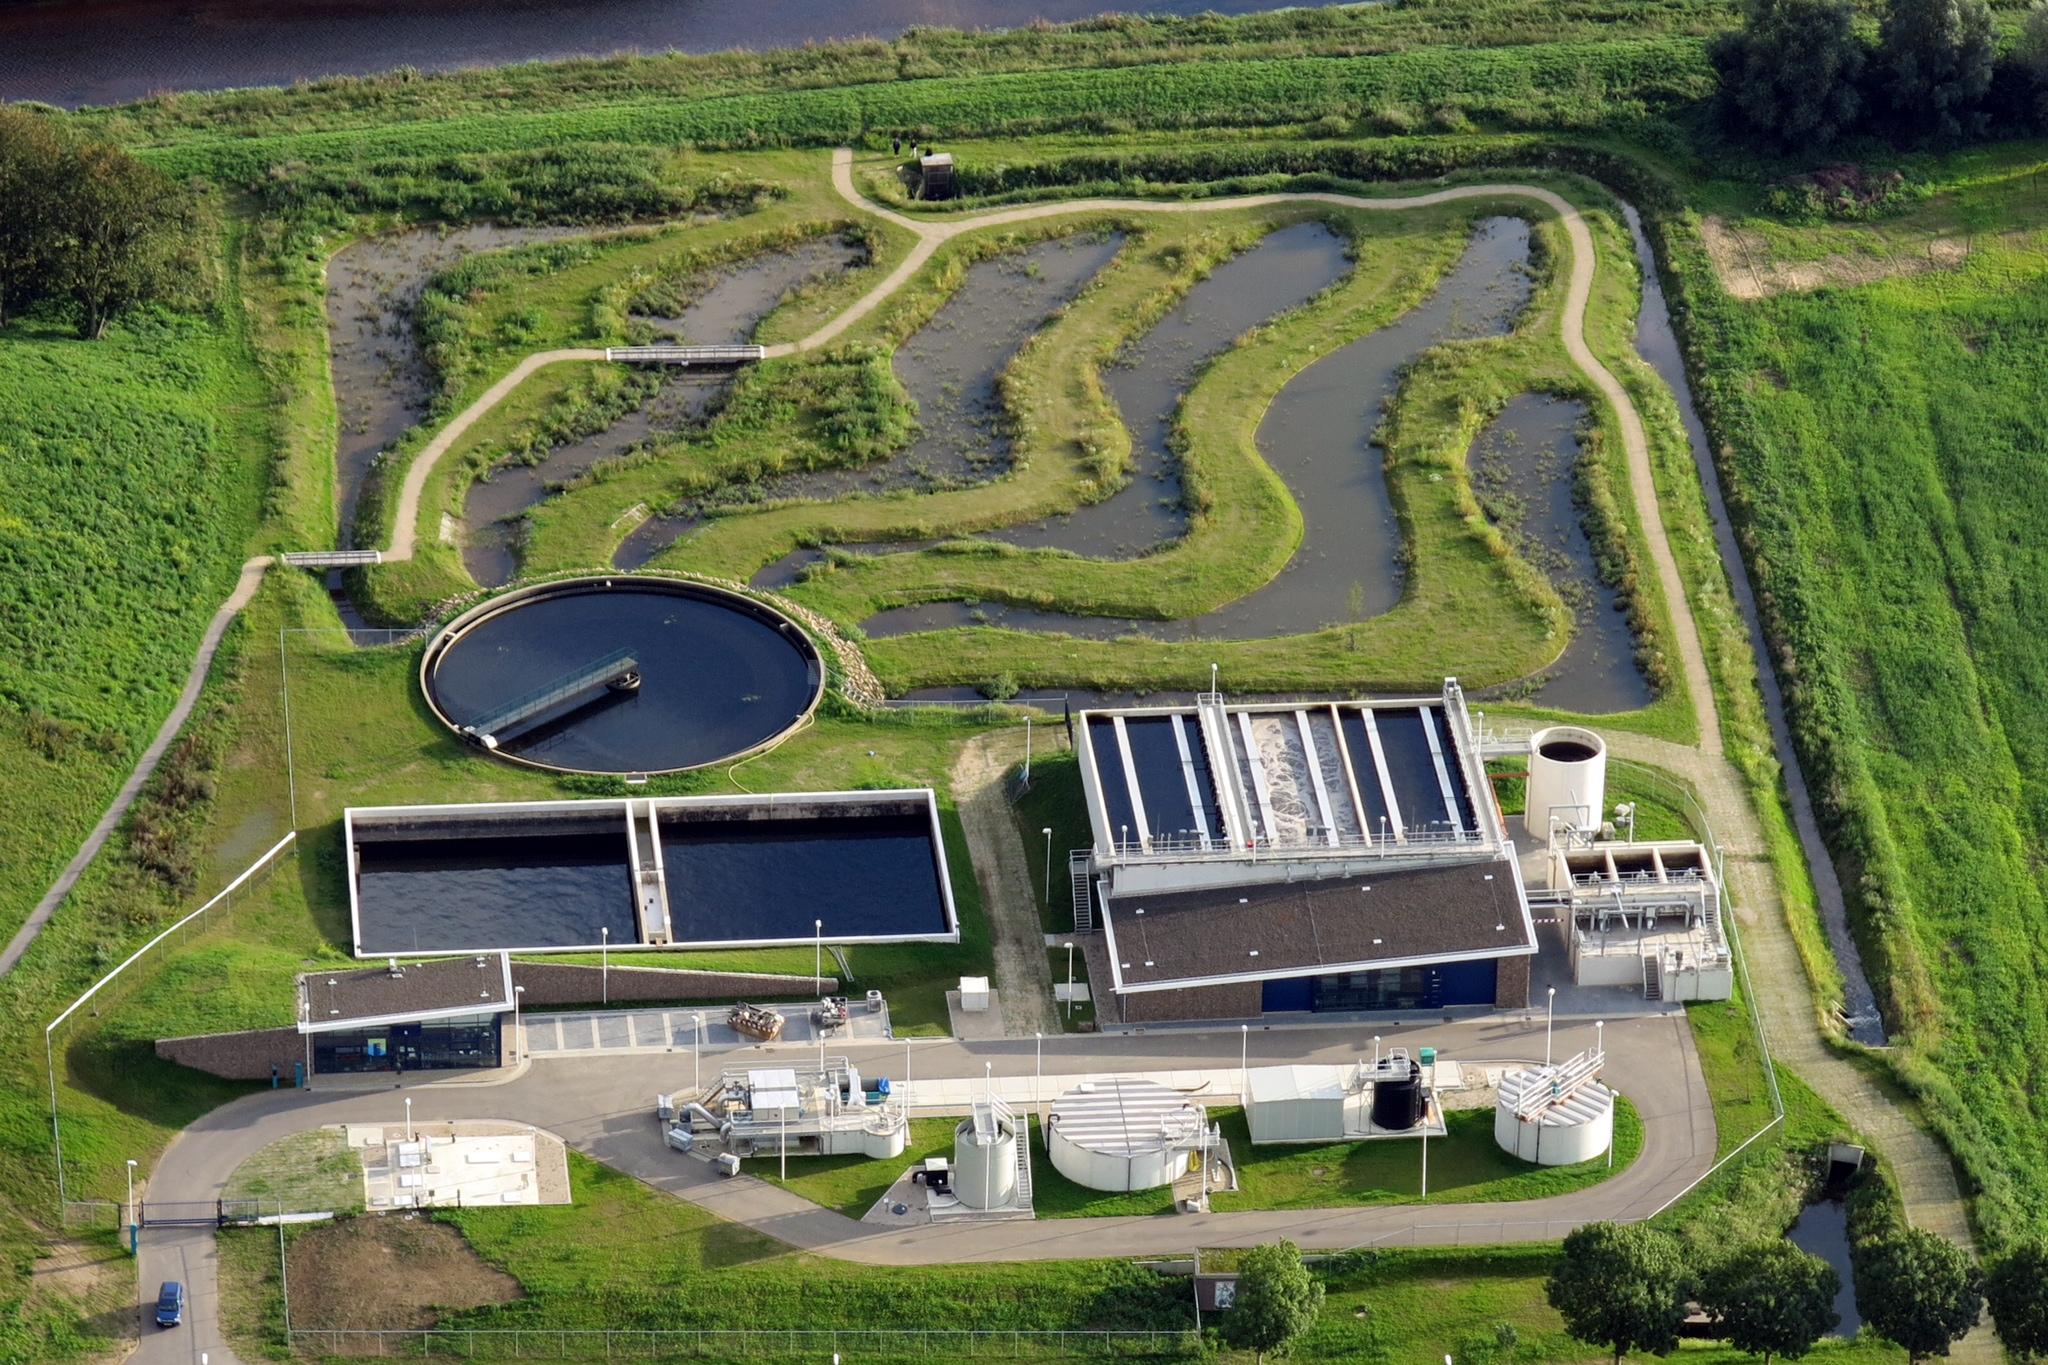
Fig. 26 Photograph of the wastewater treatment plant in Dinxperlo. The Nereda® reactors are located on the right, attached to the building with the sloped roof. The sludge buffer and the sand filter are located to the right of the Nereda® reactors. The inlet works, including the influent buffer are located at the bottom. The old pre-existing aeration tank and clarifier on the left are now part of a public water garden (on the top).#
Nitrous oxide measurements#
The nitrous oxide emission from the reactor was measured by determining the nitrous oxide concentration in the off-gas of the reactor during aeration (Fig. 27). A polyethylene floating hood with a cross-sectional area of 0.55 m2 was used to capture the air escaping the surface area of the reactor during aeration. The inside of the hood was partially filled with polyurethane foam to reduce the headspace and limit the gas retention time to the analysers. Part of the off-gas that passed through the hood was transported via a transparent hose and cooled to 4 °C to remove the moisture. The gas concentrations were measured in two online gas analysers (Rosemount NGA 2000 MLT for oxygen and carbon dioxide; Servomex 4900 for methane and nitrous oxide). Calibration of the analysers was performed using gas cylinders containing known concentrations of the studied gases. For accurate calculations, the temperature, pressure and relative humidity of the outside air were also measured, using a micro sensor (Bosch BME280). The nitrous oxide concentrations were converted into mass fluxes using the method described by Baeten [Baeten et al., 2021] .
Additional to the nitrous oxide concentration in the off-gas, the nitrous oxide concentration in the bulk liquid was measured using a nitrous oxide sensor from Unisense Environment. This sensor was placed a meter below the water surface of the reactor.

Fig. 27 Schematic representation of the off-gas measurement set-up. Both reactor off-gas and outside air were cooled to 4 °C to remove the moisture before it passed through the analysers.#
Size distribution#
The granule size distribution of the aerobic granular sludge in the reactors was measured by pouring a sample of the sludge over a series of sieves with different mesh sizes (212, 425, 630, 1000, 1400 and 2000 µm). A mixed sample of 100 mL was filtered for the determination of the total dry weight. The obtained granular biomass of the different sieve fractions and the mixed sample were dried at 105 °C until no change in weight was detected anymore.
Online measurements#
The reactor was equipped with probes for dissolved oxygen and temperature (Hach; LDO), redox potential (Hach; Redox), water level (Endress+Hauser, radar), suspended solids (Hach, SOLITAX TS), and nitrate (Hach; NITRATAX). Ammonium and phosphate were continuously measured using a filter unit and auto sampling device (Hach; FILTRAX, AMTAX and PHOSPHAX). The filter unit was situated 0.5 m below the water surface. Sampling was done at an interval of 5 min.
Offline sampling#
Samples for analyses of influent and effluent were collected using refrigerated auto samplers, collecting 24-hours flow-proportional samples for both influent and effluent. The chemical analyses of COD, total nitrogen, ammonium, phosphate, nitrite and nitrate in the reactor were performed by using the appropriate Hach Lange cuvette kits.
Emission factors#
Offline samples were taken every 14 days. To calculate the emission factor, a total nitrogen concentration in the influent (\(c_{TN,in}\)) per batch was needed. Therefore, the total nitrogen concentration in the influent was calculated for every batch using the peak ammonium concentration during aeration measured by the analyser (\(c_{NH4,max}\)), the remaining effluent ammonium concentration of the previous batch measured by the analyser (\(c_{NH4,e}\)), and the exchange ratio (\(VER\)).
Here the \(f_{ads}\) is the factor compensating for adsorption of ammonium to the granules [Bassin et al., 2011] and \(f_{org}\) is the ratio between total nitrogen and ammonium in the influent. The combined effect of these two factors was found by correlating the estimated \(c_{TN}\) with the actual values found by the 14 days offline sampling. An average value of \(f_{ads} f_{org}\) of 1.79 was found with an r-squared of 0.75.
The emission factor was calculated by dividing the total outgoing load of nitrous oxide with the total incoming load of total nitrogen, according to the following equation:
Here \(m_{N2O}\) is the total mass of the nitrous oxide in the off-gas of the batch, expressed in mg-N and \(V_{batch}\) is the batch size.
Simultaneous nitrification/denitrification#
During the aerated phase part of the nitrified nitrogen is directly converted to nitrogen gas because of the anoxic conditions in the granule. The average efficiency of simultaneous nitrification/denitrification (SND) during aeration is expressed as:
Here \(c_{NO3, min}\) is the minimum nitrate concentration at the start of the aeration phase, \(c_{NO3, e}\) is the nitrate concentration at the end of the aeration phase and \(c_{Norg, e}\) is the estimated value of the organic nitrogen in the effluent. For the latter a value of 1.5 mg L-1 is assumed.
Process control#
The aeration was controlled using a novel process control developed for aerobic granular sludge [van Dijk et al., 2020] . This control strategy targets a nitrate production rate to maximize simultaneous nitrification/denitrification. As a result, dissolved oxygen levels in the reactor are minimized as is the energy consumption.
During dry weather conditions the reactors have a fixed cycle time of 6 hours. When the flow increases due to rainy weather, the cycle will adapt to treat the increased amount of water. The feeding time will increase from 60 min minutes to 75 min and the feed flow from the buffer increases from about 180 m3 h-1 to a maximum of 600 m3 h-1. As a result, the cycle time will decrease to a minimum of 4 h (see Fig. 28).

Fig. 28 Batch scheduling for the Nereda® reactor in Dinxperlo.#
Results#
Plant performance and operation#
When the trial started the plant was already in operation for four years and the reactors contained an aerobic granular sludge bed with a biomass concentration of 8.0 g L-1. The three reactors showed normal operation during the whole trial period. The measurements were done in Reactor #1. In Table 8 the average influent and effluent quality during the measurement campaign is shown.
Parameter |
Unit |
Influent |
Effluent |
|---|---|---|---|
COD |
mg L-1 |
531 |
28 |
BOD |
mg L-1 |
202 |
2.0 |
Ntot-N |
mg L-1 |
54 |
6.0 |
NO2-N |
mg L-1 |
0.05 |
|
NO3-N |
mg L-1 |
3.3 |
|
Ptot-P |
mg L-1 |
6.4 |
1.1 |
PO4-P |
mg L-1 |
0.9 |
|
Susp. Sol. |
mg L-1 |
198 |
5.0 |
In Fig. 29 a typical batch from Dinxperlo is shown. The figure shows online measurements of the concentration of ammonium, nitrate, phosphate and dissolved oxygen during three cycles. Since these sensors were positioned at the top of the reactor, and the reactor was plug flow fed from the bottom, the measurements during feeding represent the effluent concentrations. The cycle started with a feed phase, where influent was added to the bottom of reactor and effluent was decanted from the top simultaneously. After feeding, the reaction phase started, where the reactor was aerated. The reactor was mixed by the aeration. At the start of the aeration phase the concentrations of ammonium and phosphate appear to increase, which was caused by the mixing of the bottom layer with influent water and top layer with the effluent water. After the reaction phase the biomass was allowed to settle and the cycle restarted for the next batch.

Fig. 29 Concentration profiles of ammonium (green), nitrate (orange), phosphate (black) and oxygen (blue) for three typical consecutive batches. The grey diagonal striped area indicates the feeding phase, the grey diamond grid shows the reaction phase and the grey solid area shows the settling phase.#
Monthly average nitrous oxide emission#
The nitrous oxide emission through off-gas from Reactor #1 was measured from the 9th August 2017 to 18th March 2018 (the water phase sensor was available from the 4th of October 2017). In this period the average nitrous oxide emission factor was 0.33 %.
Fig. 30 shows the monthly nitrous oxide emissions over the whole measuring period. There was a distinct difference between the summer and autumn period, compared to the winter period. In December the nitrous oxide emission factor started to rise from an average of 0.22 % in the first 4 months to a maximum of 0.64 % in February. In March, the emissions dropped again to the pre-December levels. The average water temperature declined steadily over the same period, from 20.6 °C in August down to 9.7 °C in March 2018.

Fig. 30 Top: boxplot of the monthly averaged nitrous oxide emission factor (the box extends from 25 % to 75 % values, the black line shows the median value, the black dot shows the average value and the wiskers extend the range of the data); bottom: monthly average temperature profile.#
Batch average nitrous oxide emission#
Fig. 31 shows the emission factors as well as the water temperature per batch. The graphs show that in the period between August 2017 and mid December 2017 the emission factor for most batches was between 0 % and 0.5 %, with a limited number of batches rising above 0.5 %. In this period the emission factor averaged to 0.22 %. Starting from December 2017 the variability of the emission factors increased. There were still many batches present with an emission factor of almost zero, but the maximum values increased up to 2 %. In the period between December 2017 and the end of February 2018 the emission factor averaged to 0.42 %. Starting from the last week of February 2018 this variability was again comparable to the period before December 2017.

Fig. 31 Emission factor (blue dots) and average temperature (black dashed line) per batch.#
Effect of organic loading rate/N-load#
The variability of the nitrous oxide emission factor (and with that the total emission factor) seems to be influenced by the maximum ammonium concentration in the batch (Fig. 32). The maximum emission factor (up to 2 %) was reached at ammonium concentrations between 5 and 10 mg L-1, but in this range many values close to zero were also measured. At ammonium concentrations below 5 mg L-1 and above 10 mg L-1, only few emission factors above 1 % were measured with most values between 0 % and 0.5 %.

Fig. 32 The nitrous oxide emission factor related to the ammonium peak calculated per batch.#
Effect of rain events#
Fig. 33 shows the effect of the flow to the plant on the nitrous oxide emission factor. During dry weather flow conditions (DWF) the influent flow ranged between 0 and 150 m3 h-1. Rain weather flow (RWF) conditions are characterized with an influent flow up to 600 m3 h-1 (RWF/DWF ratio of 6). During dry weather flow the emission factor (0.40 %) was higher than during rainy weather flow (0.13 %). Although the total load of nitrogen transported to the plant will not differ much between DWF and RWF conditions, the cycle time was shortened during RWF to handle the increased influent flow. The cycle time for DWF batches was typically 6 hours, while the cycle time for RWF batches was shortened to a minimum of 4 hours.

Fig. 33 Difference in emission factor of nitrous oxide between dry and rainy weather flow conditions.#
Effect of temperature#
Temperature had some effect on the variability of the emission factor as shown in Fig. 34. Temperatures above 14 °C resulted for most batches in an emission factor between 0 and 0.50 % while at temperatures below 14 °C the emission factor varied between 0 and 2 %. It is uncertain whether this was solely related to temperature, because in March the temperature was low (average at 10 °C) while the emission factor did not show this increased variability.

Fig. 34 Effect of temperature on the nitrous oxide emission factor.#
Diurnal pattern#
The emission factor did not show a clear diurnal pattern. In Fig. 35 the average emission factor per batch is shown as a function of the time of the day. The same variability was present as in the previous graphs, leading to a relatively high standard deviation. The values of the batches starting between 3:00h and 16:00h showed a lower emission than the batches between 17:00h and 02:00h. A problem in this analysis was the batch-wise operation of the reactor. The analysis was done based on the starting time of the batch, which was several hours before the actual emission of nitrous oxide was measured. Due to the 6 hours cycle time during DWF out of 1043 batches analysed in this study, only 19 started between 3 AM and 4 AM, while 71 batches started 6 PM and 7 PM.

Fig. 35 Boxplot of the diurnal pattern of nitrous oxide emission. Median value (black) based on start time of the batch (the box extends from 25 % to 75 % values, the black line shows the median value, the whiskers extend the range of the data).#
Dynamic nitrous oxide behaviour#
The complexity and dynamics of nitrous oxide emissions is illustrated in Fig. 36. Net production of nitrous oxide as well as net consumption of nitrous oxide was visible in the online measurements. The first batch started [marker 1] without any nitrous oxide in the bulk liquid and therefore also no emission through the off-gas at the start of the aeration phase. At the start of the aeration, the dissolved oxygen concentration increased, and a first peak of nitrous oxide emission could be observed [marker 2]. Also, a simultaneous decrease of the nitrate concentration was observed, caused by mixing of the nitrate remaining from the previous batch with newly fed influent, low in nitrate. When the dissolved oxygen concentration increased further, the nitrous oxide concentration in the bulk liquid and off-gas decreased again (marker [2] to [3]). In this period, the nitrous oxide production rate was lower than the combined effect of stripping through the off-gas and denitrification of nitrous oxide. Further on in the aeration phase, the nitrous oxide concentration in both the bulk liquid and the off-gas increased [marker 3]. Towards the end of the aeration phase the dissolved oxygen concentration was lowered [marker 4] and a sudden increase of the nitrous oxide concentration in the bulk liquid was seen. Hereafter the aeration, and thus mixing, was stopped allowing the biomass to settle [marker 5]. The reactor was ready to receive the next influent batch [marker 5]. During the feeding (marker [5] to [6]) the nitrous oxide concentration in the bulk liquid stayed constant because the sensor was situated at the top of the reactor and the sludge bed had settled to the bottom of the reactor. There was no sludge present in the top layer and no biological processes occurred in the top part of the reactor. After this feeding phase, the aeration phase started again, and the nitrous oxide concentration dropped due to mixing before the production started again [marker 7]. Halfway through the reaction phase, the oxygen concentration in the bulk liquid was lowered [marker 8]. This led to a period where the production of nitrate was limited, but ammonium was still being converted, thus optimizing for simultaneous nitrification and denitrification. After lowering of the oxygen concentration, a similar, although lower, initial increase of the nitrous oxide could be seen [marker 9] as was visible in the previous batch [marker 2]. At the end of this second batch the nitrous oxide was almost completely removed [marker 10].
The process control used here automatically balances nitrification and denitrification to optimize simultaneous nitrification and denitrification to get a maximum total nitrogen removal. This was done by dynamically altering the dissolved oxygen set-point and sometimes this resulted in a drop of the oxygen concentration in the reaction phase as previously described. In Fig. 38 an example of this behaviour is shown. This seems to trigger a nitrous oxide production response. When the oxygen concentration dropped [marker 1] the nitrous oxide production in the bulk liquid and the off-gas increased [marker 2].
On the 24th of February the process control was changed to a fixed oxygen set-point (2.5 mg L-1) during the reaction phase, with the reaction phase being split-up in an aeration phase and an unaerated post-denitrification phase. This had an immediate effect on the nitrous oxide production. An example of a batch under this new process control is shown in Fig. 38. During the reaction phase, almost no nitrous oxide was produced. Only when the aeration was stopped in the post-denitrification phase, some nitrous oxide was produced, but this did not lead to any emission, because the aeration was switched off and the nitrous oxide was denitrified before the end of the cycle. This change led to a decrease of the emission factor to 0.15 % during the three weeks this process control was used.
The nitrogen removal also changed slightly by the change in the process control. The average ammonium effluent concentration was 10 % higher (3.2 mg L-1 after the change, compared to 2.9 mg L-1 before the change). The average nitrate effluent concentration was similar under both process controls (5.3 mg L-1). The SND efficiency over the whole period was 69(15) %. It was 58(12) % after the change compared to 70(15) %.

Fig. 36 Batch with high concentrations of nitrous oxide (start at marker [marker 1]): initial peak due to denitrification of residual NO3-N [marker 2]; after a decline of nitrous oxide in the bulk liquid production of nitrous oxide [marker 3]; after a drop in the O2 concentration an increase of the nitrous oxide concentration in the bulk liquid [marker 4]; no denitrification of nitrous oxide at the end of the cycle at the top of the reactor because sludge has settled [marker 5]; second reaction phase starts [marker 6]; drop of nitrous oxide in the bulk liquid by pre-denitrification and mixing [marker 7]; drop in the oxygen concentration [marker 8] led to increase in nitrous oxide production [marker 9]; and no nitrous oxide left at the end of the next cycle [marker 10]. The grey diagonal striped area indicates the feeding phase, the grey diamond grid shows the reaction phase and the grey solid area shows the settling phase.#

Fig. 37 Increase of the nitrous oxide production [marker 2] when the oxygen concentration dropped to a value below 1 mg L-1 [marker 1]. The grey diagonal striped area indicates the feeding phase, the grey diamond grid shows the reaction phase and the grey solid area shows the settling phase.#

Fig. 38 Dynamics within a Nereda® cycle; different process control. The nitrous oxide appeared only in the water phase when the aeration was turned off [marker 1], leading to a very low emission factor. The grey diagonal striped area indicates the feeding phase, the grey diamond grid shows the reaction phase and the grey solid area shows the settling phase.#

Fig. 39 Typical RWF event showing a first flush [marker 1], showing little emission in the first batch [marker 2] and almost zero emission in the consecutive rainy weather batches [marker 2 to 3]; after the RWF event the emission factor stayed almost zero for a few batches [marker 4 to 6]. The grey diagonal striped area indicates the feeding phase, the grey diamond grid shows the reaction phase and the grey solid area shows the settling phase.#
A typical RWF event is shown in Fig. 39. When the flow towards the plant increased because of rainy weather, a first flush arrived at the plant, increasing the ammonium load in the reactor. The load in this batch was too high for the aeration capacity and the reduced aeration duration, leaving some elevated levels of ammonium in the effluent. The process control focussed mainly on nitrification, aerating the system at maximum capacity. Little nitrous oxide is formed in this batch. In the two batches hereafter, the load returned to normal levels, but still the focus was mainly on nitrification. In these batches, little nitrous oxide was formed. When the RWF event was finished and the flow to the plant returned to normal, the cycle times lengthened again, but still the emission of nitrous oxides remained close to zero.
Discussion#
Long term nitrous oxide emissions#
This study is the first long-term campaign measuring nitrous oxide emissions of a full-scale AGS reactor treating sewage. A Nereda® reactor at the wastewater treatment plant of Dinxperlo was monitored for 7 consecutive months. In this period an average emission factor of 0.33 % was measured. This means that 0.33 % of the incoming nitrogen load was emitted as nitrous oxide with the off-gas. The daily averaged emission factor ranged from 0.02 % to 1.58 %. These values are comparable to the values found in previous (short term) Nereda® research [van der Roest et al., 2012] . The average value found in the short-term research 0.7 % are higher than the average value found in the current research, but the value of 0.7 % is well within the variability of this long-term study, stressing the importance of long-term research. Since the emission was measured for only 7 months, the higher winter values contribute proportionately strong in the average value presented. A 12 month yearly averaged emission factor is estimated to be in the range of 0.25 % to 0.3 %.
Compared to conventional activated sludge (CAS) systems, the values obtained fall well within the reported ranges in literature. For example, in a study investigating seven CAS plants in Australia, the emission factor ranged between 0.6 % and 25.3 %, based on the amount of nitrogen denitrified [Foley et al., 2010] . Another study performing short term measurements in 12 plants in the United States showed an emission factor ranging from 0.01 % to 1.5 % [Ahn et al., 2010] . More recently a long-term measurement campaign in Switzerland showed an emission factor for the CAS system of 1.6 % to 2.0 % while a flocculent sludge SBR system showed an emission factor of 2.4 % [Gruber et al., 2020] . An overview of the emission factors for different wastewater treatment systems, adapted from Vasilaki et al. [2019] is shown Fig. 40. This underlines that the values found in this study are comparable to most other wastewater treatment systems but are considerably lower than the values generally reported for sequencing batch reactors (SBR) systems. This is remarkable, since the AGS system used in this study is operated as an SBR. This shows high emission factors are not intrinsic to SBR systems and that the correct process conditions can also lead to low emission factors.

Fig. 40 Emission factor of nitrous oxide for different wastewater treatment systems, adapted from [Vasilaki et al., 2019] . Process groups: AGS: Aerobic Granular Sludge, A/O: Anoxic/oxic reactor, A2/O: anaerobic-anoxic-oxic reactor, CAS: conventional activated sludge, MLE: Modified Ludzack-Ettinger reactor, OD: oxidation ditch, SBR: sequencing batch reactor, PN and PN/A: partial-nitritation and partial-nitritation-anammox process.#
Seasonal and diurnal variations#
For CAS systems a strong seasonal effect has been reported for the emission factor [Daelman et al., 2015, Gruber et al., 2020] , showing higher emissions at lower temperatures or increasing temperatures in early spring. In this study, a seasonal effect is also visible, as can be seen in Fig. 30 and Fig. 34. The variability of the nitrous oxide emission increases when the water temperature drops below 14 °C in December. At temperatures above 14 °C the emission factor per batch varies between 0 % and 0.5 %, while below 14 °C the emission factor ranges between 0 % and 2.5 %. Contradictorily, March shows the lowest monthly emission factor (0.15 %), at the lowest average temperature of 9.7 °C. This difference may be caused by a change in process control in March. Daelman et al. [2015] suggested this seasonal effect was primarily caused by an increase of nitrite concentrations in early spring [Daelman et al., 2015]. In the current study effluent nitrite concentrations were consistently low, with an average value of 0.05 mg L-1 (Table 8). Although nitrite concentrations were not measured during the cycle, elevated levels of nitrite during the cycle would also, at least partially, have ended up in the effluent. Since this was not the case here, no major effect of nitrite on the nitrous oxide emissions is expected.
The drop in the temperature in December was related to the inflow of melting snow, and in 4 days the water temperature in the reactor dropped from 13 °C to 8 °C. At these low temperatures of 8 °C the nitrification rates dropped considerably, but the ammonium effluent concentration was still below the consent value. At the same time, the nitrous oxide concentrations in both off-gas and bulk liquid were almost zero or below the detection limit for several days, until the temperature increased again above 9 °C. In the week before this event the variability of the emission factor was already increasing, but after this event the variability of the emission factor of nitrous oxide further increased after the water temperature was recovered to temperatures above 10 °C.
A diurnal pattern is observed in the data (Fig. 35). The batches starting between 4h and 14h show a lower average emission factor than the batches starting between 15h and 3h. The relation is not as clear as for CAS systems [Daelman et al., 2015] , which is mainly caused by the fact that the AGS reactor is a batch system, running about 4 batches per day, which does not give a high resolution over the day as in CAS systems. The lowest average emission is found between 3h and 15h. It is uncertain what causes this, but variations in batch loading may play a role. Since the reactors are operated with a fixed cycle time of 6 hours during DWF conditions, the volumetric exchange ratio is lower if the total flow to the wastewater treatment plant is lower.
Nitrous oxide in the cycle#
Nitrous oxide can be produced by both nitrification and by denitrification [Kampschreur et al., 2008, Wunderlin et al., 2012] . Ammonia-oxidizing bacteria can produce nitrous oxide from oxidation of hydroxylamine and from denitrification of nitrite under oxygen deprived circumstances. Denitrification can be both a source and a sink for nitrous oxide [Conthe et al., 2019] . Nitrous oxide is also an intermediate in the heterotrophic denitrification of nitrate. At the same time, nitrous oxide can be removed by denitrification [Conthe et al., 2019] . In aerobic granular sludge nitrification and denitrification happen simultaneously during the aeration phase, which make it difficult to distinguish nitrous oxide production from nitrification and denitrification during the aeration phase [de Kreuk et al., 2005] . Nevertheless, there seems to be clear evidence that both processes contribute to the production of nitrous oxides. In most batches there is no dissolved nitrous oxide present at the start of the cycle. In these cycles nitrous oxide production coincides with the conversion of ammonium and the production of nitrate (Fig. 36 at [marker 3]). Often, a peak of nitrous oxide at the start of the aeration phase is observed (Fig. 36 at [marker 2]). This peak seems to be caused by denitrification of nitrate left over from the previous cycle, because nitrification has not started yet. It is not clear if nitrous oxide is produced by partial denitrification caused by lack of COD at the end of the previous cycle or by rapid denitrification on readily biodegradable COD from the fresh influent. In both cases the increase of the nitrous oxide concentration is primarily caused by mixing of the reactor (aeration) and the decrease seems to be primarily caused by denitrification of nitrous oxides on readily biodegradable COD, although in the latter case stripping of nitrous oxide also plays a role.
It is likely that denitrification acts more as a sink for nitrous oxide at the start of the cycle after feeding and that denitrification acts more as a source for nitrous oxide at the end of the cycle, when most COD from the feeding phase (both storage polymers in the sludge and COD in the bulk liquid) is consumed. That would implicate the nitrous oxide production observed when nitrification starts as a net production rate resulting from production by ammonia oxidizing bacteria and denitrification by heterotrophic organisms. Understanding the mechanisms and when nitrous oxide production exceeds consumption could be important for the development of nitrous oxide emission control strategies.
The dissolved oxygen concentration is considered an important parameter to control nitrous oxide emissions, and concentrations below 1 mg L-1 during nitrification would stimulate nitrifier denitrification due to oxygen limitation [Kampschreur et al., 2009] . Oxygen limitation in biofilms is a well-known factor even under higher oxygen concentrations [Odegaard et al., 1994] . It is therefore not surprising that lower oxygen concentrations seem to result in higher nitrous oxide emissions. In Fig. 36 and Fig. 37 an increase of the nitrous oxide emission can be seen if the dissolved oxygen concentration drops below 1 mg L-1. A decreasing dissolved oxygen concentration will also shift the process to denitrification because the size of the anoxic zone within the aerobic granules will increase [de Kreuk et al., 2005] . Since this decreasing dissolved oxygen concentration mostly happens towards the end of the reaction phase, denitrification might act more as a source than a sink of nitrous oxide as carbon availability is low. This would result in a double effect on the nitrous oxide emission: both the nitrifier pathway and the denitrifier pathway could increase nitrous oxide production in this situation.
A clear effect of rain events is shown in Fig. 39. Rain events cause the batch size to increase, because more water arrives at the plant. In total 173 batches (18 %) were classified as RWF batches. These batches had an average emission factor of 0.09 %, which is less than one-third of the 0.33 % found for all batches. The reason for these lower emissions during RWF conditions is uncertain, but there are several processes influencing the emission factor during RWF. Under RWF conditions the flow to the plant increases from 0 - 175 m3 h-1 during DWF conditions to up to 600 m3 h-1 under RWF conditions. Since the reactor is operated as a sequencing batch reactor, the scheduling needs to be adapted to handle the increased inflow of wastewater [Chen et al., 2020] . This is done by decreasing the total cycle time and running more batches per day. This leads to shorter, more intense aeration phases, with higher oxygen concentrations. On average, the aeration phase during RWF is 35 minutes shorter than during DWF. Secondly RWF batches can be split in two groups. At the start of a rain event a first flush arrives at the plant, due to the presence of pressure pipelines in the sewer. The load exceeds the aeration capacity, leading to incomplete nitrification and thus less potential for nitrous oxide production. After this initial peak load, the load returns to a more average value, but the aeration remains relatively short and intense, focussing on nitrification. The lack of cycle time during RWF results in an increased nitrate effluent concentration (1.7 mg L-1 under DWF conditions and 4.4 mg L-1 under RWF conditions). The total SND efficiency on average was 69 ±15 %, but was slightly lower during RWF (65 ±13 %) compared to DWF (70 ±15 %), but during DWF batches, SND happens at lower dissolved oxygen concentrations. It also appears that the RWF event influences the DWF batches following the RWF event (Fig. 39, [5] and [6]). In these DWF batches nitrous oxide emissions are close to zero. This might be the result of the first flush at the start of the rain event, which results in a high sludge loading. A high sludge load will result in higher storage polymer concentration in the granular biomass in this specific batch, which might stretch out to the following batches. This leads to more denitrification capability of the plant. It appears that the denitrification process in these batches acts mainly as a sink for nitrous oxide, denitrifying nitrous oxide at a higher rate than it is produced. Eventually, the positive effect of the higher sludge loading will dissipate, and normal nitrous oxide emissions will return.
The nitrous oxide concentrations in the bulk liquid are seldom higher than 0.3 mg L-1 and in most cases the concentration at the end of the cycle is close to zero. This means that in most cycles the denitrification capacity of nitrous oxide is also present towards the end of the cycle. This study observed nitrous oxide conversion rates up to 1 mg L-1 h-1. This rate is a net rate, because it happens simultaneously with denitrification of nitrate, which also can produce nitrous oxide as an intermediate product. In most cases in less than 30 minutes of anoxic conditions all nitrous oxide in the bulk liquid is denitrified. This suggests a high nitrous oxide conversion potential is present, if the right conditions are met.
Effect of process control#
The nitrous oxide emission factors varied between 0.02 % and 1.58 % per day, most of the batches being below 0.5 %. The emission of nitrous oxide might be lowered by changing the process control. The decrease of the emission factor from 0.57 % in February to 0.15 % in March by changing the process control to a fixed aeration strategy is an example of this. A more stable dissolve oxygen concentration during the aeration phase led to a remarkable decrease in the emission of nitrous oxide. On the other hand, the process control focusing on simultaneous nitrification and denitrification did not lead to elevated nitrous oxide emission in the summer period.
Different process control strategies may be necessary during summer and winter conditions to limit nitrous oxide emission under all conditions.
It also seems that the production of nitrous oxide during the cycle is increasing, when the DO drops below 1 mg L-1. This could be easily prevented by adjusting the process control as to not allow for the oxygen to dip below the required set point. Another potential improvement relates to the initial peak at the start of the aeration (Fig. 36). This initial peak could be prevented by adding a pre-denitrification phase to the cycle, aiming to remove this residual nitrate, simultaneously removing the nitrous oxide formed during settling and feeding. Another option is to focus on post-denitrification to prevent high amounts of residual nitrate to be present in the next cycle, thereby limiting the nitrous oxide emission peak.
Compared with a continuously fed activated sludge system, an SBR system gives a much higher information density on the changes in nitrous oxide production and consumption. This gives the possibility to develop effective process control strategies to minimize the nitrous oxide emissions. A maximum nitrous oxide concentration of 0.3 mg L-1 and a net denitrification rate up to 1 mg L-1 h-1 was measured. This would mean that a denitrification phase of 20 minutes should be enough to remove nitrous oxide from the water phase in most cases. Splitting the main aeration phase and adding one or more intermediate denitrification steps could be an effective measure to minimize nitrous oxide emission.
Difference with conventional SBR systems#
The AGS reactor was operated as a sequencing batch reactor. A comparison with flocculent SBR systems is therefore of interest. As shown in Fig. 40, regular SBR systems have shown to have higher emission factors than continuously fed activated sludge systems. High nitrous oxide emissions in SBRs are attributed to sudden changes in the concentrations of ammonium, nitrate and nitrite within the cycle or to accumulated dissolved nitrous oxide during anoxic settling and decanting in the subsequent aerobic phase [Vasilaki et al., 2019] . These conventional SBR systems show emission factors up to 5.6 % which is much higher than the value of 0.33 % found in this study. This might be caused by differences in process conditions. The feeding in the AGS process is strictly anaerobic, which is achieved by plug flow feeding from the bottom of the reactor. By this plug flow, the nitrate remaining in the reactor from the previous cycle is pushed upwards while the reactor is filled with fresh influent from the bottom. This limits the contact between sludge, COD and nitrate, preventing production of high levels of nitrous oxide during the feeding phase. While anaerobic plug flow feeding is a requirement in AGS systems, it is uncommon in SBR systems. For example, in a study by [Rodriguez-Caballero et al., 2015] the SBR reactors were alternatingly fed anoxically and aerobically resulting in an emission factor of 6.4 %.
Comparison water phase and gas phase measurement#
The nitrous oxide concentration was measured by two different methods: firstly, by measuring the nitrous oxide concentration in the bulk liquid by means of an online sensor and secondly by measuring the nitrous oxide concentrations in the off-gas via a gas analyser. The latter has the benefit of measuring the emission during aeration directly without the need for converting water phase concentration into emissions to the air. The downside of the off-gas method is the lack of information about what happens during the anaerobic and the anoxic phase, when the aeration is turned off. The water phase sensor gives direct insight into the production of nitrous oxide in the anoxic phase and the denitrification of nitrous oxide in the anoxic phase. The water phase sensor thus provides information that otherwise would be lost or obscured by other nitrous oxide forming processes during aeration. For the use in process control both methods can be used, but the water phase sensor is likely more effective, as it also gives information about the non-aerated phases.
Conclusions#
A 7-month measurement campaign of the emission of nitrous oxide was performed in the Nereda® reactor of Dinxperlo. Key findings include:
An average nitrous oxide emission factor of 0.33 % was found over a 7-month measuring campaign spanning summer and winter.
The yearly average emission factor was estimated between 0.25 % and 0.30 %.
The emission factor was comparable with continuously fed activated sludge plants with low emissions and lower than values found for conventional SBR systems.
Both nitrification and denitrification appeared to contribute to the nitrous oxide production, denitrification acting both as a source and a sink for nitrous oxide.
Post-denitrification significantly reduced the nitrous oxide concentration in the reactor.
An increased variability of the emission factor was observed at low temperatures.
Different process control between summer and winter could limit the emission factor.
In the winter period, aeration on a fixed oxygen setpoint reduced the emission factor compared to aeration using variable oxygen setpoint.
A temporary increase of the sludge loading decreased the emission factor for several batches.