Settling behaviour
Contents
Settling behaviour#
Parts of this chapter have been published in Water Research 186, (2020) [van Dijk et al., 2020].
Abstract#
The settling behaviour of AGS in full-scale reactors is different from the settling of flocculent activated sludge. Current activated sludge models lack the features to describe the segregation of granules based on size during the settling process. This segregation plays an important role in the granulation process, and therefore, a better understanding of the settling is essential. The goal of this study was to model and evaluate the segregation of different granule sizes during settling and feeding in full-scale aerobic granular sludge reactors. For this, the Patwardhan and Tien model was used. This model is an adaption of the Richardson and Zaki model, allowing for multiple classes of particles. To create the granular settling model, relevant parameters were identified using aerobic granular sludge from different full-scale Nereda® reactors. The settling properties of individual granules were measured, as was the bulk behaviour of granular sludge beds with uniform granular sludge particles. The obtained parameters were integrated in a model containing multiple granule classes, which was then validated for granular sludge settling in a full-scale Nereda® reactor. In practice a hydraulic selection pressure is used to select for granular sludge. Under the same hydraulic selection pressure, the model predicted that different stable granular size distributions can occur. This indicates that granular size distribution control would need a different mechanism then the hydraulic selection pressure alone. This model can be used to better understand and optimize operational parameters of AGS reactors that depend on granular sludge size, like biological nutrient removal. Furthermore, insights from this model can also be used in the development of continuously fed AGS systems.
Introduction#

Fig. 14 Graphical abstract.#
In biological wastewater treatment, the liquid/solid separation through gravity induced settling is an important step in producing clean effluent [Henze et al., 2008]. Therefore, the settling behaviour of conventional activated sludge has been intensively studied over the years. For the design of secondary clarifiers, a good understanding of the settling behaviour of activated sludge is necessary and both design guidelines [Henze et al., 2008] and dynamic models [Takács et al., 1991, Vesilind, 1968] are readily available. These guidelines generally use the sludge volume index or the zone settling velocity as input parameters for describing the settling behaviour of activated sludge. For dynamic modelling of the settling of activated sludge several generally accepted empirical relations are available relating the settling velocity to the solids concentration [Torfs et al., 2017]. These empirical relations can be used to dynamically describe the settling of sludge in secondary clarifiers, thereby ensuring proper design and operation of the conventional activated sludge plants.
Aerobic granular sludge is a technology enabling removal of nutrients and liquid/solid separation in one tank due to the advantageous settling properties and unique granular structure of the aerobic granules [Adav et al., 2008, Gao et al., 2011, Heijnen and van Loosdrecht, 1998, Pronk et al., 2015, van der Roest et al., 2011]. The settling behaviour of aerobic granular sludge under full-scale conditions has not yet been studied. This is mostly because the full-scale aerobic granular sludge process is a novel technology. So far, the settling of aerobic granular sludge has only been studied with granules obtained from laboratory reactors [Liu et al., 2005, Ni et al., 2009, Winkler et al., 2012, Nor Anuar et al., 2007]. These reactors are usually operated with synthetic influent leading to a fully granulated system without flocs. In practice there always is a non-granular sludge fraction present of 10 - 20 % [Pronk et al., 2015, van Dijk et al., 2018] of the total mass which might influence the overall settling behaviour. Also, laboratory experiments mainly focused on the settling behaviour of individual granules, not the settling behaviour of the granular sludge bed as a whole. As such it is not yet possible to model settling of full-scale aerobic granular sludge.
The settling velocity of granules in a bed is much lower than that of an individual granule. Solid separation theory shows that the influence a settling particle experiences from surrounding particles depends on the degree of particle coherence [Perry et al., 1997]. Conventional activated sludge flocs will tend to flocculate, which slows down the settling velocity of the sludge [Vesilind, 1968]. Aerobic granular sludge by definition does not coagulate [de Kreuk et al., 2007] and is thought to maintain its discrete settling properties, even in a concentrated sludge bed. For small biofilm-coated particles it was shown that the settling behaviour could be well described using fluidized bed theory [Nicolella et al., 1999]. Because of the similarities in size, structure and density between biofilm-coated particles and aerobic granular sludge it was theorized that the settling of aerobic granular sludge might also be described by fluidized bed theory.
Current activated sludge models, for example the widely used Takács model [Takács et al., 1991], lack the features to describe the segregation of granules based on size during the settling process. The process of hydraulic sludge selection is a key element in the operation of granular sludge reactors [Qin et al., 2004]. Larger granules have higher settling velocities than flocs and small granules [Winkler et al., 2012] and as such they can be preferentially retained in the reactor under hydraulic selection pressure. In an upwards fed reactor, larger granules are more likely to receive substrate, because they settle faster to the bottom of the reactor and thus receive substrate. This differential settling of different sludge fractions is not covered in current settling models. Another feature not well described by the current models is the stacking of granules at the bottom of the reactor. Sludge flocs in a concentrated bed will slowly compress to higher concentrations, while granules will stack on top of each other, when the maximum packing grade is reached. For a better understanding of these processes a model describing the segregation of granules in the reactor based on settling properties is necessary. A potential model was proposed by Cui et al. [2019], but not further developed. Also Dold et al. [2019] proposed a model, but in this model only flocs and one class of granules was used, and all granules were allowed to survive the selection pressure. While this approach might serve the purpose of describing the average conversions in an AGS reactor, no insight can be gained in the granulation process itself. Moreover, it cannot be used to predict the influence of the granular size distribution on the biological conversions. Also for the development of continuously operated granular sludge reactors [Kent et al., 2018] a good settling model will be essential.
The goal of this study was to implement a model describing the segregation of different granule sizes during settling and feeding in an aerobic granular sludge reactor. For this, the model proposed by Patwardhan and Tien [1985] was adopted. This model is an implementation of the Richardson and Zaki model [Richardson and Zaki, 1954], allowing for multiple classes of particles. To create a granular sludge settling model, relevant parameters were identified using aerobic granular sludge from different full-scale Nereda® reactors. The settling properties of individual granules were measured as was the bulk behaviour of uniform granular sludge beds. The obtained parameters were introduced in a model containing multiple granule classes, which then was validated based on an experiment in a full-scale Nereda® reactor.
Methodology#
Description of the plants#
In this study aerobic granular sludge from three Nereda® plants was used, namely from Garmerwolde, from the full-scale in Utrecht and from the PNU. For a description of these plants see section Nereda® plants used in this research . Sludge characteristics (mixed liquor suspended solids (MLSS), volatile suspended solids (VSS), sludge volume index after 30 minutes (SVI30), the granule fraction in sludge (AGS fraction) and the COD loading rate) of these plants during the experiments are given in Table 6.
plant |
MLSS |
VSS |
SVI30 |
Gran. |
COD load |
|---|---|---|---|---|---|
(kg m-3) |
(kg m-3) |
(mL g-1) |
(%) |
(kgCOD kgMLSS-1 d-1) |
|
Garmerwolde |
6.5 |
5.0 |
60 |
64 |
0.10 |
Utrecht |
6.7 |
5.2 |
42 |
81 |
0.076 |
PNU |
8.9 |
7.2 |
39 |
78 |
0.078 |
Size distribution#
The granule size distribution of the sludge in the Nereda® reactors used in these experiments varied. Aggregates larger than 200 µm are considered to be granules, although the non-granular fraction smaller than 200 µm at least partly shows the same granular morphology. These small aggregates are the proto-granules (see chapter On the mechanisms). To determine the granule size distribution 1 L of sample was poured over a series of sieves with different mesh sizes (212, 425, 630, 1000, 1400 and 2000 µm). A mixed sample of 100 mL was filtered for the determination of the total dry weight. The obtained granular biomass of the different sieve fractions and the mixed sample were dried at 105 °C until no change in weight was detected anymore.
Density measurements#
The Percoll centrifugation method was used to measure the density of the granules [Etterer and Wilderer, 2001, Winkler et al., 2013]. Centrifugation was performed for 120 min at 12.000 rpm (15,777 g) in a Stratos Biofuge (Heraeus Instruments). A standard (non-swing out) rotor holding plastic tubes containing 10 mL solution was used. The speed-up setting on the Biofuge was 9, and the slow-down setting was 1. The slow reduction of speed was set to limit the change of sudden slowdown on the granule position in the Percoll. Marker beads were added ranging from 1,023 to 1,084 kg m-3.
Voidage measurements#
The minimum voidage between granules was measured with the Dextran Blue method [Beun et al., 2002]. Granules were sieved with tap water and a known volume (between 300 and 400 mm) was added to a graduated measuring cylinder. An amount of 300 mg of Dextran Blue was weighed on an analytical balance, dissolved in a small amount of water and added to the measuring cylinder. Then the measuring cylinder was filled to 1000 mL and stirred. After settling of the granules, a sample of the supernatant was taken and filtered with a Millipore 0.45 µm glass fiber filter to remove small particulate matter. The concentration of Dextran Blue in the sample was then measured with a spectrophotometer at 620 nm. Based on the dilution of the Dextran Blue and the known volume of the granular bed, the voidage between the granules was calculated according the following formula, where \(V\) is the volume of the cylinder, \(c_{db}\) the concentration of Dextran Blue, \(m_{db}\) the mass of the Dextran Blue and \(V_{bed}\) is the volume of the settled sludge:
Measurement of terminal velocities#
To determine the terminal velocity of individual granules, sludge was sieved using sieves with mesh sizes of 212, 425, 630, 1180, 1700 and 2000 µm. Sieved granules were placed in a glass measuring cylinder with a height of 43 cm and a diameter of 6 cm. The cylinder was filled with tap water at room temperature. The granules were pre-conditioned and washed with tap water. Since the difference of the total dissolved solids of tap water (254 mg L-1) and effluent (439 mg L-1) was small, the effect of using tap water instead of effluent on the settling velocity likely was very small. The settling of granules was recorded using a video camera in order to determine the settling time for a marked distance of 20.7 cm. The camera was placed perpendicular to the exact mid-point of the marked settling distance to minimize parallax errors. The settling velocity was subsequently calculated by dividing the marked distance by the settling time. The influence of the wall effect on the measured settling velocity was evaluated based on the method described by Di Felice [1996]. In the worst-case situation (granules of 2 mm) this effect was less than 2.5 %. This was deemed sufficiently low to be negligible.
Measurement of bed expansion#
Experiments with full-scale aerobic granular sludge were performed using a setup, adapted from Baldock [Baldock et al., 2004]. Using this setup (Fig. 15) the settling characteristics of granules of different sizes were measured. The height of the column was 200 cm with an inner diameter of 153.6 mm. The lower 18 cm of the column was used as a flow equalization section, and therefore filled with glass marbles. On top of the marbles there was a mesh support, to prevent granules to cross into the equalization section. The volume above the mesh was partially filled with granules for the experiment. The granules were obtained by sieving granules directly from a full-scale aerobic granular sludge reactor, using sieves with mesh sizes of 1000 and 2000 µm.
Effluent of the wastewater treatment plant was fed from the bottom of the column using a peristaltic pump. The water was fed at upflow velocities between 3 and 15 m h-1 to fluidize the granular bed. The upflow velocity was increased in steps until the granular bed reached the top of the column. Then the upflow velocity was decreased in steps until the bed was completely settled again. At every step the upflow velocity was kept constant until no change in the bed height was detected anymore. The effluent was removed through a hole in the wall at the top of the column.
Full-scale settling of a mixed granular bed#
Settling of a mature granular bed was measured in the full-scale Nereda® reactor in Utrecht, which is a 12,000 m3 reactor containing 6.7 g L-1 of MLSS. First the reactor was intensely mixed by aerating for 20 min and a sample was taken to determine the biomass concentration. After the aeration the sludge bed was allowed to settle. Samples of the sludge bed were taken at different levels below the water surface (0, 2, 4, 6 and 7 m) after 0, 5, 10, 15 and 17 minutes. The samples were taken with a Kemmerer sampling bottle of 1.5 L and sieved to measure the granule size distribution.

Fig. 15 Column used for measuring bed settling characteristics of aerobic granular sludge.#
Modelling of terminal velocity#
The terminal settling velocity of a spherical particle in a fluid can be calculated based on a force balance:
Here \(F_W\) is the weight of the particle, \(F_B\) is the buoyancy and \(F_D\) is the drag force.
The weight of a particle can be calculated from the diameter \(d\) and the density \(\rho_B\) using the following equation, where \(g\) is the gravitational acceleration:
With a similar equation the buoyancy can be calculated, using \(\rho_L\) for the density of the surrounding liquid:
The drag force of the particle while falling in the fluid is calculated by:
where \(v_t\) is the terminal velocity of the particle and \(C_D\) is the drag coefficient. Combining equation (14) to (17) leads to the equation for the terminal velocity of a particle:
For particle Reynolds numbers (\(Re\)) below 0.1 the value of \(C_D\) can be calculated using Stokes law. Since settling of aerobic granular mostly takes place in the intermediate flow regime (\(0.1 < Re < 1000\)) another relationship needs to be adopted. Also, equations (15) to (18) assume smooth, rigid, spherical particles. Although aerobic granules have a nearly spherical shape, they are not always smooth or rigid. Therefore, a specific empirical relation for the drag coefficient has to be established for aerobic granular sludge. Several empirical relationships exist to relate the drag coefficient \(C_D\) to the particle Reynolds number [Nicolella et al., 1999]. A common approach is the use of the equation:
where \(a\) and \(b\) are empirical constants to be fitted to the type of particles. The parameters \(a\) and \(b\) are only valid in a specific range of the particle Reynolds number. The latter is calculated by:
Here \(\mu\) is the dynamic viscosity of the liquid.
In this study the values of \(a\) and \(b\) where measured using the column set-up described earlier.
Modelling of bed behaviour#
The Richardson and Zaki equation [Richardson and Zaki, 1954] is widely used to model the bed expansion of rigid spherical particles:
Here \(v\) is the fluidizing velocity, \(\epsilon\) is the voidage fraction, \(v_f\) is the extrapolated fluidizing velocity at a voidage fraction of unity and \(n\) is the expansion index. In the original work of Richardson and Zaki, \(v_f\) was found to be equal to the terminal velocity \(v_t\) for installations where the reactor diameter was much larger than the particle diameter, according to equation:
Later it was shown that if the density of the particles approaches the density of the fluid, this relation is incorrect and \(v_f\) is at least 20 % smaller than \(v_t\) [Nicolella et al., 1999, Di Felice, 1995].
The expansion index \(n\) is also a function of the flow regime. Richardson and Zaki proposed a relation with the particle Reynolds number. Others studies [Andalib et al., 2012] found a relation to the Archimedes number more suitable for describing the relation between flow regime and expansion index. In this study we use the relation given by Mulcahy and Shieh [1987] which is based on the Reynolds number (equation (23)), but in chapter On the mechanisms we use a relation based on the Archimedes number (equation (35)) as we found that better suits a integral model, also describing settling of flocs.
The Richardson and Zaki equation is only valid for mono-disperse solids. Since an aerobic granular sludge bed generally consists of granules with sizes in the range of 200 - 5000 µm (see Table 7), a multi-disperse approach is needed to model the fluidization and settling of aerobic granular sludge beds. Multiple solutions describing multi-disperse solids exist [Yang, 2003] and here the approach described by Patwardhan and Tien [1985] was used. The granules are divided in \(N\) classes with subscript \(j\), and the local settling velocity is calculated based on an apparent voidage \(\epsilon_j\). This leads to the following equation:
Here \(k_j\) is a correction factor for wall effects. This factor can be set to unity for large full-scale reactors where the diameter of the reactor \(d_{R}\) is much larger than the granule diameter and consequently has less impact. For smaller reactors (for example lab reactors), the value of k can be calculated according to:
The density of the sludge bed \(\rho_{bed}\) is based on the density and the volumetric concentration \(\theta\) of each class:
The apparent voidage factor \(\epsilon_j\) is calculated for every fraction based on the bulk voidage \(\epsilon_L\) using equation (27):
The average granule size is calculated based on the volumetric concentration, the granule diameter and the voidage:
When the sludge bed reaches the minimum voidage, no settling of granules will occur anymore. In the model this is simulated by simply setting the settling velocity to zero below the minimum voidage. This also implies a minimum fluidization velocity, corresponding with the settling velocity at minimum voidage. Although this was not specifically measured in the experiments, this behaviour was observed during the experiments that were performed.
Results#
Terminal velocity#
The terminal velocities of granules obtained from the Nereda® reactor in Garmerwolde were measured by dropping individual granules in a measuring cylinder. The obtained terminal velocities with granule sizes between 200 and 2000 µm are presented in Fig. 16. Since the granules were sieved, this yielded a range of granule sizes per class, for example between 212 and 425 µm and thus a range of settling velocities. Per class a minimum, average and maximum settling velocity was calculated, and these values were attributed to the minimum, average and maximum granule size of the class. The terminal velocity varied between 10.6 and 86.5 m h-1 as shown in Fig. 16.
Using the Percoll method a density for granules of 1035 ± 14 kg m-3 was found for full-scale granules. With this density the drag coefficient can be calculated using equation (18). Also the particle Reynolds number can be calculated using equation (20). Then a plot can be made of the drag coefficient versus the particle Reynolds number (Fig. 17). These data were used to estimate the coefficients \(a\) and \(b\) of equation (19). At values \(a = 22.57\) and \(b = -0.690\) we found the best fit with the data.

Fig. 16 Terminal velocity of individual granules from the full-scale Nereda® plant in Garmerwolde; the data points were used to fit the drag coefficient \(C_D\) according to equation (18).#

Fig. 17 Drag coefficient of individual granules from the full-scale Nereda® plant in Garmerwolde; the data points were used to fit the \(a\) and \(b\) parameters of equation (19).#
The experiments resulting in Fig. 16 were all obtained with relatively spherical and smooth granules. Sometimes granules are not smooth and spherical and for example finger-type outgrowths exist at the surface of the granules. This can have a negative effect on the settling velocity. Fig. 18 shows the difference between smooth spherical granules and granules with finger-type outgrowth on the granule surface for granules of 1.7 and 2.0 mm. The difference in terminal velocity is up to 27 %. and seems to be larger for smaller granules. A comparison of smooth granules and granules with outgrowth is shown in Fig. 19.

Fig. 18 Comparison of settling velocity of smooth granules and granules with finger-type outgrowth. Granules from the Nereda® plant in Garmerwolde.#
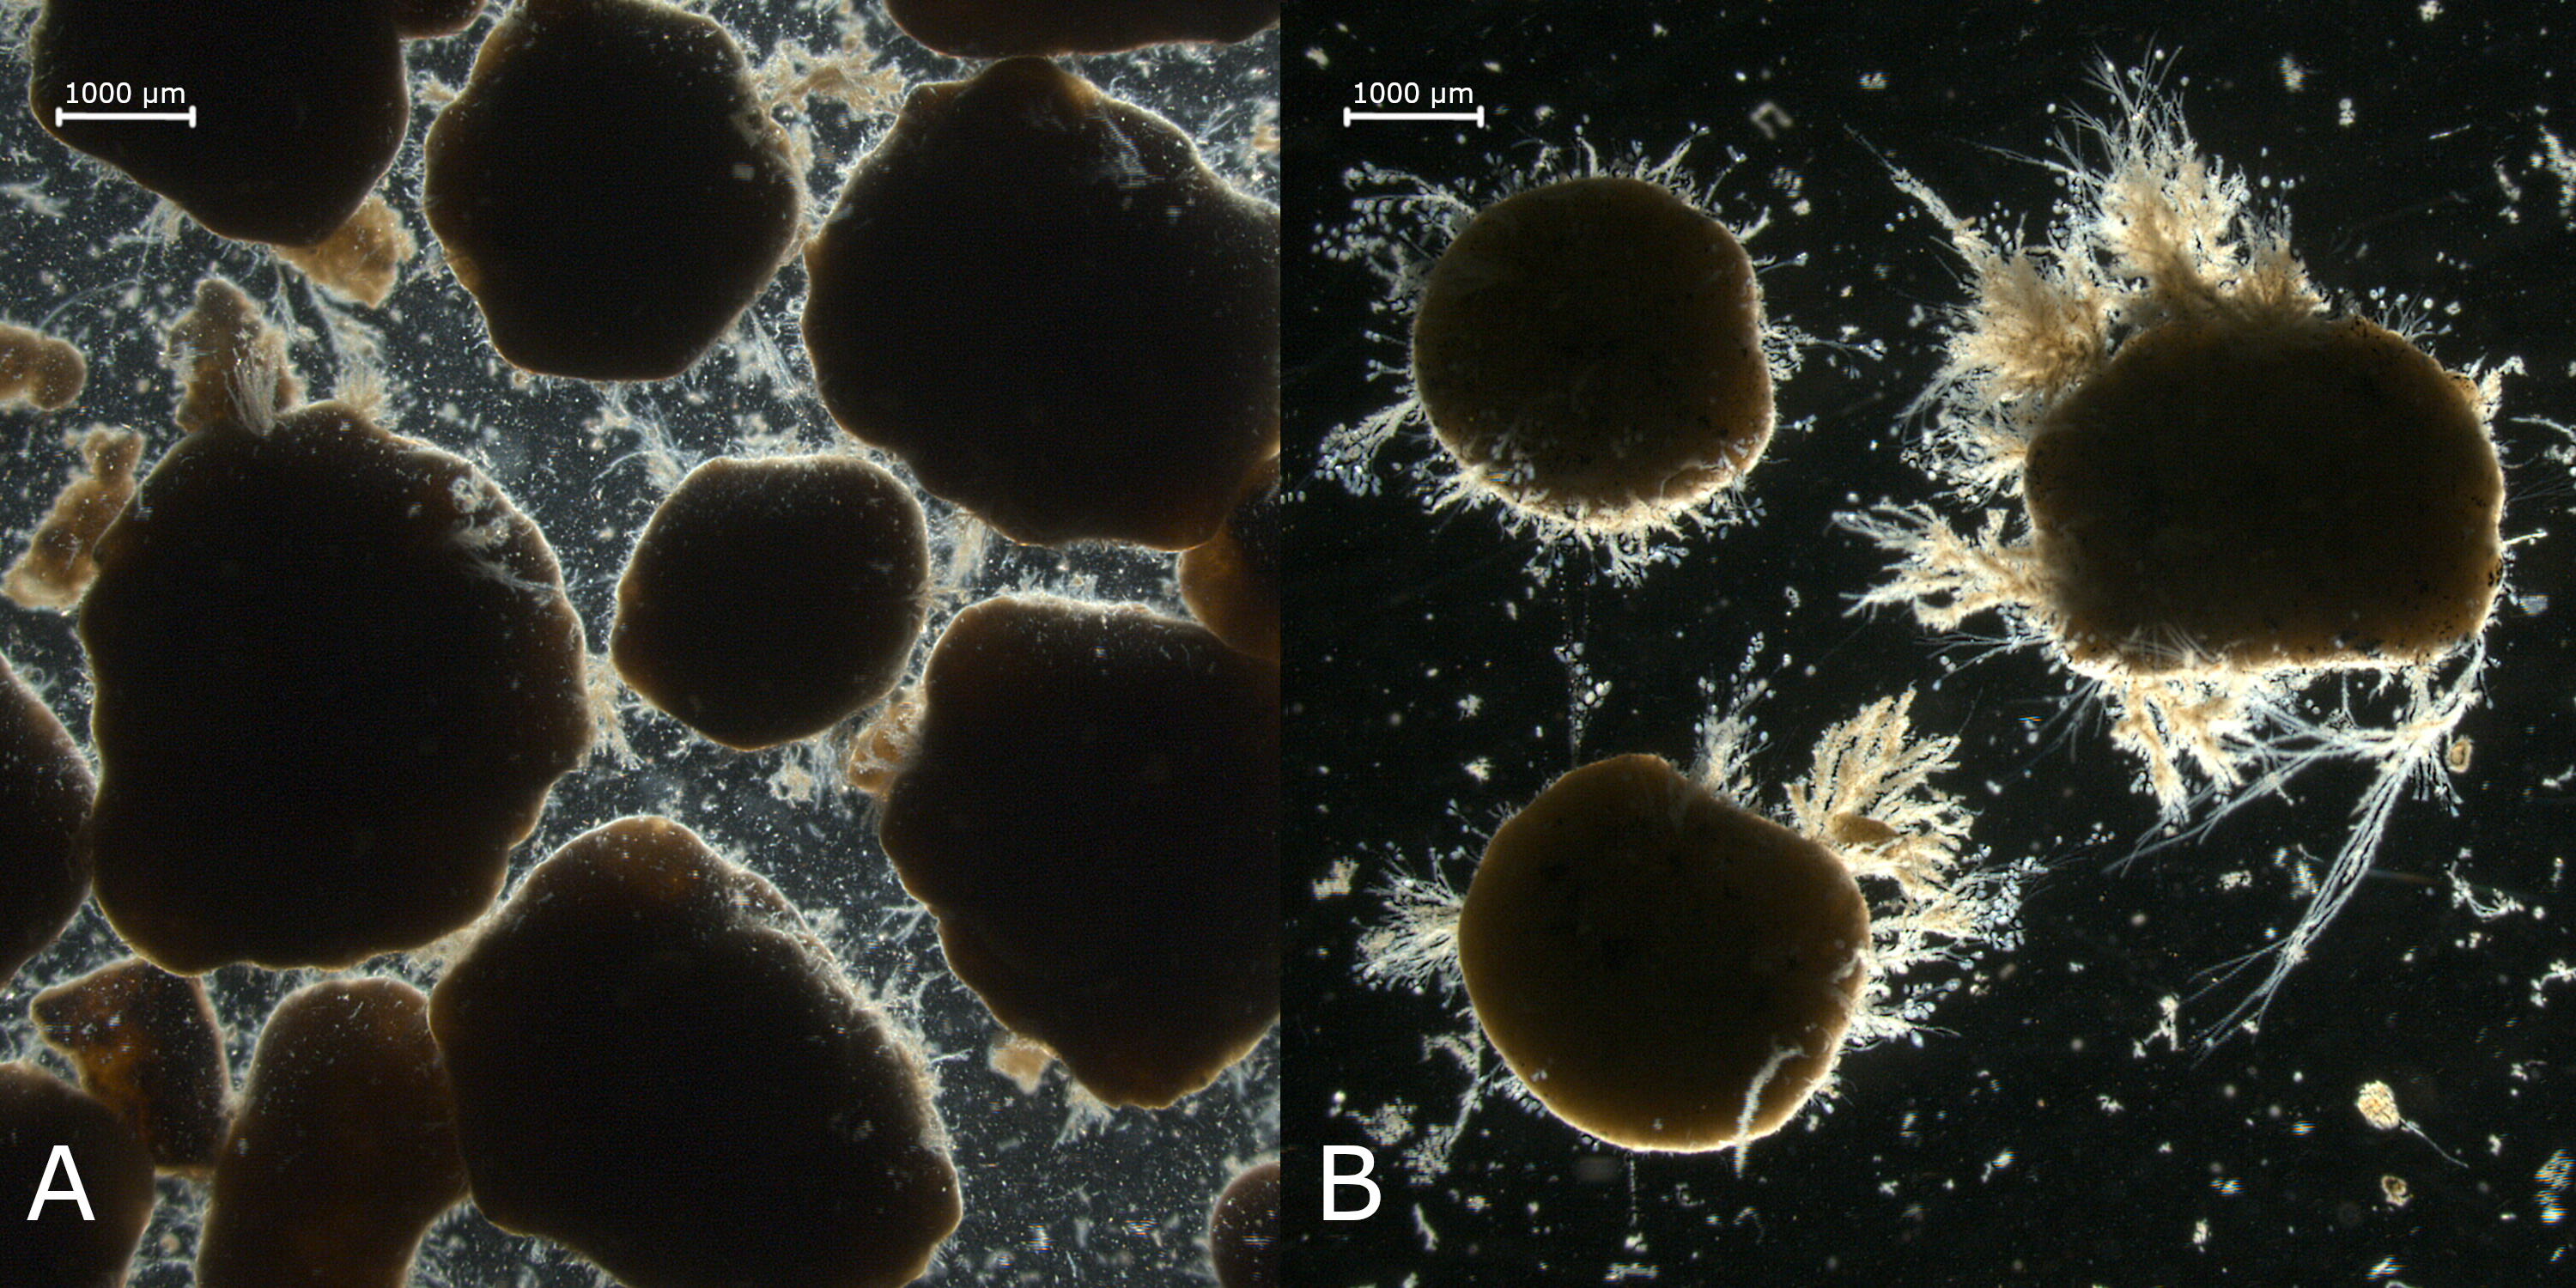
Fig. 19 Comparison of smooth granules (A) and granules with finger-type outgrowth (B). Granules from the Nereda® plant in Garmerwolde.#
Bed expansion#
The results of the bed expansion experiment for granules from the PNU of sizes between 1 and 2 mm are shown in Fig. 20. The experiment was started with a sludge bed of 47 cm of sieved granules. The voidage fraction of de sludge bed was 51.9 %. The up-flow velocity was increased in steps from 6.0 - 14.1 m h-1. At an up-flow velocity of 14.1 m h-1 some of the granules started to wash out, because the top of the sludge blanket reached the outlet of the column. Subsequently the up-flow velocity was reduced in steps from 14.4 - 3.3 m h-1. After the experiment some segregation in the sludge bed could be noticed, showing larger granules at the bottom of the column and smaller granules at the top of the sludge blanket.

Fig. 20 Bed expansion experiment with sieved granules (1 -2 mm) from the Prototype Nereda® Utrecht; data points were used to fit the extrapolated fluidizing velocity and the expansion index according to equation (21).#
The data from the bed expansion experiment were used to estimate the parameters of the Richardson and Zaki model. At an average granule size of 1.5 mm we found a value of \(v_f\) of 29.9 m h-1 and an expansion index \(n\) of 5.65. The extrapolated fluidizing velocity \(v_f\) of 29.9 m h-1 is 50 % lower than the terminal velocity for granules of 1.5 mm calculated with equation (18) to (20) and the parameters for \(a\) and \(b\) calculated in the previous paragraph, which yield a \(v_t\) of 60.4 m h-1.
Full-scale bed settling#
In the full-scale Nereda® reactor in Utrecht a settling experiment was performed to measure the settling of a mature granular bed. The results were used to validate the multi-disperse settling model. The parameters that were identified using the sludge from Garmerwolde and from the Prototype Nereda® in Utrecht were used in this multi-disperse settling model for the full-scale Nereda® in Utrecht. Since all three plants are treating domestic wastewater, we expect that the observed parameters are valid for granular sludge reactors operated with similar type of domestic wastewater.
The granule size distribution of the sludge bed is shown in Table 7. The table also shows the class average diameter, which is used in the model.
class |
class mean diameter |
concentration |
|---|---|---|
(µm) |
(µm) |
(kg m-3) |
0-212 |
106 |
1.28 |
212-425 |
318 |
0.82 |
425-630 |
527 |
0.28 |
630-1000 |
815 |
0.63 |
1000-1400 |
1200 |
1.03 |
1400-2000 |
1700 |
1.39 |
> 2000 |
3000 |
1.22 |
In Fig. 21 an example of the results is shown. The figure shows the measurements and simulation results for the different granule fractions at the start of the experiment (0 min) and after 15 min of settling. The concentration of the granule fraction is shown on the x-axis and the depth below the water surface is shown on the y-axis. At the start of the simulation the reactor is assumed to be completely mixed. In the experiment this was done by intense aerating for 20 min. After the aeration was stopped the sludge started to settle.
After 15 min the model shows that the largest fraction (> 2000 mm) is almost settled, and granules are stacking on top of each other at the bottom of the reactor. The model calculates that at the bottom the minimum voidage fraction is already reached after 5 min. On the other hand, the smallest fraction (212 - 425 µm) only just started to settle. Only in first meter from the top of the reactor a decrease of this fraction can be seen in the model results. At the sampling point 2 m below the water surface even no change compared to the start was detected, which is also observed in the model results. Only at the bottom first meter of the reactor an increase of this fraction can be seen. The measured sludge concentrations are well resembled by the model for all fractions.
For the middle fractions and especially for the fraction of 1400 - 2000 µm a peak in the solids concentration can be seen at a depth just below 6 m. This is caused by the lower concentration of the largest fraction at this water depth, because this fraction is already almost completely settled below 6 m. The smaller fractions settle on top of the larger fraction, allowing for the smaller fractions to reach higher concentrations.
Fig. 22 shows the measurements and simulation results for the granule fraction between 1000 µm and 1400µm. For every time frame the concentration of the granule fraction is shown on the x-axis and the depth below the water surface is shown on the y-axis. After 5 min no change was measured at the sampling points, which is resembled by the model. After 10 min the concentrations at the upper sampling point goes down and the concentration at the lower sampling point goes up. This behaviour is also resembled by the model, although at the lower sampling point the concentrations seems to increase a bit faster than in the model. After 15 min and 17 min the model and the sampling show similar behaviour.
The results for the other fractions also showed a good agreement between model and the measurements performed at the full-scale installation. These results can be found in appendix Settling experiment.

Fig. 21 Settling of 6 classes of granules in a full-scale Nereda® reactor in Utrecht after 0 minutes and after 15 minutes; model results (dashed line: 0 minutes, solid line: 15 minutes) and measurements (dots).#

Fig. 22 Settling of granules of sizes between 1000 µm and 1400µm in a full-scale Nereda® reactor in Utrecht; model results (line) and measurements (dots) at settling times between 0 and 17 minutes.#
Discussion#
Terminal settling velocity#
This study showed that the terminal settling velocity of aerobic granular sludge can be well described by a model based on Newtonian drag. The proposed formula to calculate the drag coefficient (equation (29)) was tested for particle Reynolds numbers between 1 and 50. The coefficients of the formula are different from the values reported in literature [Nicolella et al., 1999] for biofilm coated particles. This is not remarkable since the average density of the aerobic sludge granules used in this study was considerably lower than the density of the biofilm coated particles.
Bed expansion characteristics#
The bed expansion experiment showed good correlation with the Richardson and Zaki model (equation (21)). In the experiment sieved granules were used in the range of 1000 - 2000 µm. The experiment yielded an expansion index \(n\) of 5.65 for an average granule size of 1.5 mm, which is close to the value of 5.79 given by equation (23). The ratio between the terminal velocity \(v_t\) and the extrapolated fluidizing velocity \(v_i\) was close to 0.5. For biofilm-coated particles a value of 0.8 was found by Nicolella et al. [1999]. According to Nicolella et al. [1999] it is not uncommon for large low-density solids that this ratio is lower than unity, but no explanation was given.
Full-scale validation#
As shown in the full-scale experiment in the Nereda® reactor in Utrecht, a mature aerobic granular sludge bed can consist of a wide range of granule sizes. The difference in setting velocity can be an order of magnitude, leading to segregation in the sludge bed: the largest granules will settle much faster than the smallest granules. This leads to a high concentration of large granules at the bottom of the reactor after only a few minutes of settling, while the smallest granules are still distributed throughout the reactor. To describe this behaviour a single fraction Richardson and Zaki model does not suffice and a multi-disperse version of the Richardson and Zaki model was adopted, using the Patwardhan and Tien extension. With this extended model it was possible to describe the settling experiments performed at the full-scale Nereda® reactor in Utrecht well, without any further calibration of the model.
Selection pressure#
In AGS reactors a hydraulic selection pressure to selectively retain granules over flocs is applied. This is especially relevant during the start-up phase when granules are still relatively small. The differential settling rate of granules and flocs is essential for this selection process. Excess sludge is typically removed from the top of the sludge blanket after a settling period, removing the slower settling sludge (flocculent matter, small granules or eroded material from larger granules) from the reactor and thereby selecting for the better settling granules in the reactor. Using the hydraulic selection pressure as a sludge wasting mechanism is a good method for making the cut-off between granules and flocs and it is often used as the only sludge wasting mechanism. The downside of using the selection pressure as the only wasting mechanism is that it does not directly influence the granule size distribution. This is important, because the granule size distribution will influence overall nutrient removal. The differences in diffusion limitation into the granules and differences in overall MLSS concentrations will lead to different nutrient removal rates [Chen et al., 2011, Ni and Yu, 2010, de Kreuk et al., 2005].
Using the model, it can be shown that different stable granule size distributions can exist at the same selection pressure. A uniform sludge bed with granules of 700 µm can be as stable regarding selection pressure as a disperse bed with granules in the range of 200 - 5000 µm. This is shown in Fig. 23. After 30 minutes of settling the bed height of the uniform bed and the disperse bed are equal. However, when granules grow too large, they become difficult to suspend by aeration and they will get diffusion-limited during the anaerobic feeding phase. Therefore, it is necessary to remove both selection sludge and excess granular sludge in aerobic granular sludge reactors with a well-developed sludge bed. This implies that a dynamic selection pressure is needed to control the granule size distribution in the reactor. In full-scale reactors this can be done by increasing the selection pressure to remove specific granule sizes. The here developed model combined with a bioconversion model [Ni and Yu, 2010] could be used to predict the optimal selection pressure and granule size for every cycle of an AGS reactor.

Fig. 23 Comparison of the settling of a uniformly sized (A) and a disperse (B) granular sludge bed both after 30 minutes of settling. Left: uniform bed with 8 g L-1 granules of 700 µm, right: disperse bed with 8 g L-1 (sizes: 318, 527, 815, 1200, 1700 and 3000 µm; concentration: 1, 1, 1, 1, 2, and 2 g L-1.#
Differences between settling of flocs and granules#
Fig. 24 schematically shows the effect of the degree of particle coherence on the settling behaviour of sludge particles. Conventional activated sludge flocs typically reside on the right part of this schematic: small flocs coagulate into larger flocs adapting a zone settling regime and at higher concentrations, under influence of the surrounding sludge flocs, a compression regime. In contrast, aerobic granules typically reside on the left side of the schematic: per definition they do not coagulate [de Kreuk et al., 2007] and will remain in the particle settling regime even at high concentrations. As shown in the full-scale experiment in the Nereda® reactor in Utrecht, after reaching the minimum voidage fraction the granules are stacked on top of each other, and they do not undergo an extensive compression regime. This will especially be the case for laboratory AGS reactors. In a full-scale AGS reactor a mature granular bed will typically have a fraction of 1 - 2 kg m-3 smaller than 200 µm because of wash-in of suspended solids in the influent, sheared off parts of large granules and because of less optimal sludge selection compared to a laboratory reactor. The fraction smaller than 200 µm will also for a part consist of proto-granules. The question arises if the multi-disperse Richardson and Zaki also applies for the non-granular fraction smaller than 200 µm. In the full-scale test this fraction was not measured, so no data is available. Although the floc fraction was not taken into account in the full-scale experiment in Utrecht there was a good resemblance between measurements and model, also for the smallest granule fractions. If the non-granular fraction would have a large impact on the settling behaviour of the granules, it would likely be influencing the smallest fractions. This was not observed in the experiment. It therefore appears that the effect of flocs on the settling behaviour was limited in the experiment. In chapter On the mechanisms a slightly modified version of the model is used, which better describes the settling of the proto-granules and flocs.
Sludge morphology#
Fig. 18 shows the difference in terminal velocity of smooth spherical granules and granules with outgrowth on the sphere surface. A difference of 27 % was measured for granules of 1.7 mm. No measurements were done on the interaction between granules with outgrowth in a sludge bed, but it is expected that in a reactor with many granules with outgrowth on the surface the settling velocity will be even more reduced. When an AGS reactor is operated at a certain selection pressure, a sudden increase of granules with outgrowth can lead to a drop in the sludge concentration in the reactor, because many granules with outgrowth will be removed via sludge selection (which typically is set to maintain a constant sludge bed height after the set settling time). Small changes in granule morphology therefore can have a major impact on the stability of the granular bed and ultimately effluent quality can be affected.

Fig. 24 Effect of particle coherence on settling behaviour, adapted from Perry et al. [1997].#
Potential applications of the settling model#
To show the effect of the granule size distribution on nutrient removal in full-scale aerobic granular sludge reactors, a settling model is required, since nitrogen and phosphorus removal will depend on both sludge concentration and granule size [de Kreuk et al., 2007]. Large granules will be more diffusion-limited for processes requiring oxygen in comparison to small granules [Pérez et al., 2005]. Small granules will therefore have a lower anoxic volume and their contribution to simultaneous denitrification will consequently be less. Moreover, larger granules will reside more at the bottom of the reactor because of superior settling behaviour. Since the currently used batch fed reactor types are fed from the bottom [de Kreuk et al., 2005], large granules will receive more COD during anaerobic uptake. The combination of larger granules storing more COD during anaerobic feeding and larger granules being more diffusion-limited for oxygen during aeration gives them a large role in simultaneous nitrification/denitrification [Xavier et al., 2007]. Our proposed settling model could be combined with already existing conversion models to gain more insight in the influence of settling and segregation of granules on overall conversion rates. The model could also be used for optimizing other operational parameters, such as the MLSS concentration, mixing energy and aeration strategy.
Another potential application of the multi-disperse settling model is in the understanding of continuously fed AGS reactors. These reactors are currently under development [Devlin and Oleszkiewicz, 2018, Zou et al., 2018]. Conventional activated sludge systems operated with clarifiers for sludge/water separation will require different design and operation, when the sludge partially consists of granules. Larger granules will settle faster than small granules and flocs, resulting in a different distribution of granules and flocs over the clarifier depth. This differential sedimentation can even be used to perform a form of sludge selection [Zou et al., 2018]. The flow patterns in a final clarifier are more complex than in batch wise operated granular sludge reactors with feeding from the bottom and need to be better investigated. The here proposed multi-disperse settling model in combination with a CFD model can be used to investigate and optimize the clarification process in traditional settlers of continuous AGS reactors.
Conclusion#
A multi-dispersed settling model was made describing the settling and fluidization of aerobic granular sludge. Validation of this model with measurements in a full-scale AGS reactor showed a good resemblance between model and measurements.
The model is based on the Richardson and Zaki model for multi-disperse particles.
A relation between granule size and drag coefficient was established describing the terminal velocity of individual granules based on granule size.
The parameters of the Richardson and Zaki model were measured with mono-disperse granules. The extrapolation at a voidage of unity of the fluidizing velocity is approximately 50 % of the terminal settling velocity.
The model can be used for optimizing the selection pressure in AGS reactors and for improving nutrient removal. The presented results can be used to better understand the granulation process and can be valuable for future research of continuously fed AGS reactors.